ARC Resources Ltd. reports fourth quarter and year end 2013 results
Feb 5, 2014
")
CALGARY, Feb. 5, 2014 /CNW/ - (ARX - TSX) ARC Resources Ltd. ("ARC") is pleased to report its fourth quarter 2013 operating and financial results. Fourth quarter production averaged 100,883 boe per day and funds from operations were $237.8 million ($0.76 per share). ARC's Audited Consolidated Financial Statements and Notes, as well as ARC's Management's Discussion and Analysis ("MD&A") for years ended December 31, 2013 and 2012, are available on ARC's website at www.arcresources.com and on SEDAR at www.sedar.com.
| Three Months Ended December 31 | Twelve Months Ended December 31 | |||||
| 2013 | 2012 | 2013 | 2012 | |||
| FINANCIAL | ||||||
| (Cdn$ millions, except per share and boe amounts) | ||||||
| Funds from operations (1) | 237.8 | 208.4 | 861.8 | 719.8 | ||
| Per share (2) | 0.76 | 0.68 | 2.76 | 2.42 | ||
| Net income | 13.6 | 84.5 | 240.7 | 139.2 | ||
| Per share (2) | 0.04 | 0.27 | 0.77 | 0.47 | ||
| Operating income (3) | 49.1 | 59.2 | 223.9 | 163.1 | ||
| Per share (2) | 0.16 | 0.19 | 0.72 | 0.55 | ||
| Dividends | 94.0 | 92.5 | 374.0 | 357.4 | ||
| Per share (2) | 0.30 | 0.30 | 1.20 | 1.20 | ||
| Capital expenditures, before land and net property acquisitions (dispositions) | 207.7 | 184.5 | 859.9 | 598.5 | ||
| Total Capital expenditures, including land and net property acquisitions (dispositions) | 224.1 | 192.0 | 820.8 | 640.4 | ||
| Net debt outstanding (4) | 1,011.5 | 745.6 | 1,011.5 | 745.6 | ||
| Shares outstanding, weighted average diluted | 313.9 | 308.4 | 311.9 | 297.2 | ||
| Shares outstanding, end of period | 314.1 | 308.9 | 314.1 | 308.9 | ||
| OPERATING | ||||||
| Production | ||||||
| Crude oil (bbl/d) | 35,542 | 32,938 | 32,784 | 31,454 | ||
| Condensate (bbl/d) | 2,580 | 1,767 | 2,251 | 2,217 | ||
| Natural gas (mmcf/d) | 359.4 | 348.2 | 349.4 | 342.9 | ||
| NGLs (bbl/d) | 2,868 | 2,978 | 2,811 | 2,728 | ||
| Total (boe/d) (5) | 100,883 | 95,725 | 96,087 | 93,546 | ||
| Average realized prices, prior to hedging | ||||||
| Crude oil ($/bbl) | 82.85 | 80.50 | 88.90 | 82.03 | ||
| Condensate ($/bbl) | 88.72 | 86.70 | 94.13 | 92.63 | ||
| Natural gas ($/mcf) | 3.61 | 3.32 | 3.45 | 2.62 | ||
| NGLs ($/bbl) | 41.47 | 36.13 | 36.25 | 38.11 | ||
| Oil equivalent ($/boe) (5) | 45.51 | 42.49 | 46.15 | 40.50 | ||
| Operating Netback ($/boe) | ||||||
| Commodity and other sales | 45.80 | 42.62 | 46.31 | 40.58 | ||
| Transportation expenses | (1.83) | (1.26) | (1.72) | (1.29) | ||
| Royalties | (6.42) | (5.71) | (6.36) | (5.72) | ||
| Operating expenses | (9.21) | (8.80) | (9.66) | (9.40) | ||
| Netback before hedging | 28.34 | 26.85 | 28.57 | 24.17 | ||
| Realized hedging gain (6) | 0.41 | 1.26 | 0.45 | 1.87 | ||
| Netback after hedging | 28.75 | 28.11 | 29.02 | 26.04 | ||
| TRADING STATISTICS (7) | ||||||
| High price | 29.95 | 26.00 | 29.95 | 26.25 | ||
| Low price | 25.68 | 22.32 | 23.12 | 18.36 | ||
| Close price | 29.57 | 24.44 | 29.57 | 24.44 | ||
| Average daily volume (thousands) | 1,030 | 1,146 | 1,064 | 1,356 | ||
| (1) | Funds from operations does not have a standardized meaning under Canadian Generally Accepted Accounting Principles ("GAAP"). See "Additional GAAP Measures" in the MD&A for the years ended December 31, 2013 and 2012. |
| (2) | Per share amounts (with the exception of dividends) are based on weighted average diluted shares. |
| (3) | Operating income does not have a standardized meaning under GAAP. See "Non-GAAP Measures" in the MD&A for the years ended December 31, 2013 and 2012. |
| (4) | Net debt does not have a standardized meaning under GAAP. See "Additional GAAP Measures" in the MD&A for the years ended December 31, 2013 and 2012. |
| (5) | In accordance with NI 51-101, a boe conversion ratio of 6 Mcf: 1 bbl has been used, which is based on an energy equivalency conversion method primarily applicable at the burner tip. Given that the value ratio based on the current price of crude oil as compared to natural gas is significantly different than the energy equivalency of the conversion ratio, utilizing the 6:1 conversion ratio may be misleading as an indication of value. |
| (6) | Includes realized cash gains and losses on risk management contracts, plus a reversal for unrealized gains and losses on risk management contracts that relate to current year production that have been recognized in netback calculations in prior quarters. In 2012, realized gains on foreign exchange contracts were not included in the netback calculation as they related solely to debt. |
| (7) | Trading prices are stated in Canadian dollars and based on intra-day trading. |
"2013 was an excellent year punctuated by the milestone achievement of reaching 100,000 boe per day of production in the fourth quarter," said Myron Stadnyk, President and CEO. "Our team executed the most significant capital program to date, delivering record production, safely commissioning the new Parkland/Tower facility, and replacing 200 per cent of production at low F&D costs. Our continued focus on profitable growth resulted in a 20 per cent increase in funds from operations in 2013. Looking ahead to 2014, we are well positioned to deliver year-over-year production growth and provide significant value for our shareholders."
FINANCIAL AND OPERATIONAL HIGHLIGHTS
-
ARC achieved record fourth quarter and full year average production of
100,883 boe per day and 96,087 boe per day, respectively. Fourth
quarter production was up five per cent from the fourth quarter of 2012
and full year 2013 average production was three per cent higher than
2012. Higher production at Ante Creek and Parkland/Tower along with
strong performance at Pembina contributed to the increase in 2013.
ARC's fourth quarter oil and liquids production reached a record 40,990
barrels per day, nine per cent higher than the fourth quarter of 2012.
ARC's fourth quarter and full year 2013 production met guidance
targets, which was a significant achievement given the divestment of
approximately 2,000 boe per day of gas weighted non-core production
during 2013. ARC expects 2014 annual average production to be in the
range of 110,000 to 114,000 boe per day.
-
ARC commenced the initial flow of restricted volumes of oil and natural
gas production through its new Parkland/Tower gas processing and
liquids handling facility late in the fourth quarter of 2013.
Construction of the new facility was completed ahead of schedule. Upon
commissioning of the plant, ARC had an inventory of 26 previously
drilled wells at Tower and Parkland which were tied into the facility
and ready to be brought on-stream. The existing wells will be
systematically brought on production over the course of the first
quarter of 2014. ARC plans to drill additional wells at Tower and
Parkland in 2014 and expects to fill the facility over the course of
the next 12 to 18 months.
- ARC's 2013 year-end reserves and resources evaluation reflected growth in reserves and reaffirmed the significant resource potential in the northeastern British Columbia Montney region ("NE B.C. Montney"). See February 5, 2014 news release "ARC Resources Ltd. Announces Sixth Consecutive Year of 200 Per Cent or Greater Produced Reserves Replacement in 2013" for additional information.
- Replaced approximately 200 per cent of 2013 total production, adding 68.4 mmboe of Proved plus probable ("2P") reserves in 2013
- Four per cent increase in 2P reserves to 634 million boe
- Finding and Development ("F&D") costs of $12.79 per boe, before changes in future development capital ("FDC"), and $11.47 per boe including changes in FDC
- Four per cent increase in 2P crude oil and natural gas liquids ("NGL's") reserves to 194 mmbbls
-
2P recycle ratio of 2.2 times and 3.3 times for the current year and
three year average, respectively, based on current and three year
average F&D costs, before changes in FDC, and ARC's 2013 and three year
average netbacks of $28.57 per boe and $27.24 per boe, respectively
-
Fourth quarter and full year 2013 commodity sales revenues of $425
million and $1.6 billion were up 13 per cent and 17 per cent,
respectively, relative to 2012 levels. The increase was due to higher
realized crude oil and natural gas prices. Although crude oil and
liquids production accounted for 41 per cent and 39 per cent of fourth
quarter and full year production, respectively, they contributed
approximately 71 per cent and 73 per cent of fourth quarter and full
year sales revenues.
-
Fourth quarter funds from operations were $237.8 million ($0.76 per
share), up 14 per cent from the fourth quarter of 2012. Full year 2013
funds from operations were $861.8 million ($2.76 per share), 20 per
cent higher than 2012. The increase in fourth quarter and full year
2013 funds from operations was primarily due to higher production and
higher crude oil and natural gas prices in 2013.
-
Funds from operations included realized hedging gains of $3.9 million
and $15.7 million on ARC's commodity, foreign exchange and power
hedging contracts for the fourth quarter and full year 2013,
respectively.
-
Operating income was $49.1 million ($0.16 per share) and $223.9 million ($0.72 per share)
for the fourth quarter and full year 2013, respectively. Full year
2013 operating income increased 37 per cent relative to 2012 due
primarily to higher production and higher crude oil and natural gas
prices in 2013.
-
Fourth quarter capital expenditures, prior to crown land purchases and
net property dispositions, totaled $207.7 million, resulting in full
year capital spending of $859.9 million. ARC's capital program focused
primarily on oil and liquids-rich opportunities at Parkland/Tower, Ante
Creek, Pembina, southeast Saskatchewan and Manitoba along with spending
on natural gas development at Dawson and Sunrise. ARC drilled 26 gross
operated wells in the fourth quarter of 2013 (21 oil wells, two
liquids-rich natural gas wells and three natural gas wells), resulting
in 167 gross operated wells being drilled in 2013 (139 oil wells, 15
liquids-rich natural gas wells and 13 natural gas wells).
-
ARC completed $15.9 million of land purchases and "tuck-in" acquisitions
in key development areas during the fourth quarter of 2013 and $50.7
million of land and "tuck-in" acquisitions for the full year 2013. The
acquisitions targeted the Montney and Pembina Cardium regions. ARC
grew its Montney land holdings from 724 net sections to 899 net
sections during 2013 with the most significant additions being at Ante
Creek and Attachie.
-
During 2013, ARC divested of certain non-core assets for gross proceeds
of approximately $90 million with associated production of
approximately 2,000 boe per day (65 per cent natural gas) and proved
plus probable reserves of 6.8 mmboe. Proceeds from the divestments
were used to further strengthen ARC's balance sheet and to partially
fund ARC's 2013 capital program including the acceleration of drilling
projects at Ante Creek and Sunrise in the fourth quarter of 2013.
-
ARC closed the year with a strong balance sheet including total
available credit facilities of $2 billion with debt of $901.3 million
drawn. ARC had available credit of approximately $1 billion after a
working capital deficit. Net debt to 2013 funds from operations ratio
was 1.2 times and net debt was approximately ten per cent of ARC's
total capitalization at the end of the fourth quarter; both metrics are
well within ARC's target levels.
-
ARC paid a dividend of $0.30 per share to shareholders for the fourth
quarter of 2013 and has confirmed a dividend of $0.10 per share to
shareholders for January 2014 to be paid on February 18, 2014. ARC has
conditionally declared a dividend of $0.10 per share, payable monthly
for February 2014 through April 2014, subject to confirmation by
monthly news release and subject to any further resolution of the Board
of Directors. ARC has maintained the monthly dividend at $0.10 per
share or higher since inception in 1996, with payments totaling $29.78
per share since inception through January 15, 2014.
- ARC plans to execute a $915 million capital program in 2014, prior to spending on land and net property acquisitions, with a continued focus on high rate of return oil and liquids-rich gas development and low cost, high rate of return natural gas development. ARC expects 2014 full year production to average between 110,000 and 114,000 boe per day, representing 17 per cent year-over-year production growth. ARC has a strong balance sheet and sufficient available credit capacity to fund the 2014 capital program. Additional details can be found in the November 6, 2013 news release titled "ARC Resources Ltd. Announces a $915 million Capital Program Targeting 17 per cent Growth in Production in 2014" filed on SEDAR at www.sedar.com.
ORGANIZATIONAL UPDATE
Chief Financial Officer Appointment
ARC is pleased to announce the appointment of Van Dafoe to the position of Senior Vice President and Chief Financial Officer effective February 5, 2014. As previously announced, Steve Sinclair retired from his position as Senior Vice President and Chief Financial Officer at the year-end board meeting. Steve will continue as an Officer of the company, in an advisory role, until his formal retirement from ARC in the later part of 2014. Van is currently the Senior Vice President, Finance, a position he has held since June 2011. First joining ARC in 1999 as Controller, Van has taken on increasingly senior positions and has a proven track record as a strong and insightful leader. Working under Steve Sinclair's mentorship, he has overseen ARC's financial strategy and execution with direct responsibility for all finance, marketing, taxation and risk management activities. Van has a Bachelor of Commerce degree (Honours) from the University of Manitoba and is a Certified Management Accountant with over 25 years of industry experience. ARC has deliberately planned this CFO succession process over the past few years.
Vice President Engineering Appointment
ARC is pleased to announce the promotion of Lara Conrad to the position of Vice President, Engineering, replacing Terry Anderson who was appointed to the position of Senior Vice President and Chief Operating Officer in December 2013. Lara joined ARC in 2011 as an exploitation engineer working on the Pembina Cardium team and was subsequently promoted to Manager of Engineering, Southern Team in 2013. Prior to joining ARC, Lara worked for a major Canadian oil and gas entity where she gained broad engineering and management experience. Lara has diverse experience in reservoir, exploration, development and production engineering across a wide range of western Canadian assets. Lara has a Bachelor of Science degree in Mechanical Engineering from the University of Waterloo and is a member of the Association of Professional Engineers and Geoscientists of Alberta.
ECONOMIC ENVIRONMENT
ARC's 2013 financial and operational results were impacted by commodity prices and foreign exchange rates which are outlined in the following table.
| Selected Benchmark Prices and Exchange Rates (1) | Three Months Ended | Twelve Months Ended | ||||||||||
| December 31 | December 31 | |||||||||||
| 2013 | 2012 | % Change | 2013 | 2012 | % Change | |||||||
| Brent (US$/bbl) | 109.35 | 110.08 | (1) | 108.73 | 111.67 | (3) | ||||||
| WTI oil (US$/bbl) | 97.50 | 88.20 | 11 | 98.00 | 94.19 | 4 | ||||||
| Edmonton Par (Cdn$/bbl) | 86.64 | 83.96 | 3 | 93.16 | 86.10 | 8 | ||||||
| Henry Hub NYMEX (US$/mmbtu) | 3.61 | 3.34 | 8 | 3.65 | 2.79 | 31 | ||||||
| AECO natural gas (Cdn$/mcf) | 3.15 | 3.05 | 3 | 3.16 | 2.40 | 32 | ||||||
| Cdn$/US$ exchange rate | 1.05 | 0.99 | 6 | 1.03 | 1.00 | 3 | ||||||
| (1) | The benchmark prices do not reflect ARC's realized sales prices. For average realized sales prices, refer to Table 13 in the MD&A for the three and twelve months ended December 31, 2013 and 2012. Prices and exchange rates presented above represent averages for the respective periods. |
West Texas Intermediate ("WTI") crude oil prices averaged US$98.00 for the year, four per cent higher than 2012. Brent crude oil prices remained strong throughout 2013 on expected growth in global crude oil demand and ongoing geopolitical uncertainty. Canadian crude oil differentials remained volatile throughout 2013 as the result of higher North American crude oil production, refinery outages, and constrained takeaway and infrastructure capacity. The benchmark Canadian crude oil price, Edmonton Par, averaged $93.16 per barrel in 2013, eight per cent higher than 2012. The WTI/Edmonton Par differential ranged from a discount of US$1.36 per barrel to a discount of US$19.31 per barrel during the course of 2013. The differential averaged a discount of US$7.57 for the year and widened in the fourth quarter to a discount of US$14.97 per barrel, resulting in lower revenues for western Canadian producers. Certain pipeline and infrastructure projects and additional crude oil rail capacity are scheduled to come on-stream in 2014, and are expected to alleviate certain bottlenecks which have negatively impacted Canadian crude oil differentials. In the near term, it is expected that crude oil differentials will remain volatile throughout 2014 until additional infrastructure capacity is available to meet the growing North American production.
Natural gas prices increased substantially in 2013 with the NYMEX Henry Hub ("NYMEX") and AECO monthly ("AECO") prices both approximately 30 per cent higher than 2012 levels. ARC's realized price on natural gas is primarily referenced to the AECO Hub. Continued growth in US natural gas production has contributed to a widening of the NYMEX/AECO differential, which averaged a discount of US$0.60 per mmbtu and US$0.59 per mmbtu in the fourth quarter and the full year 2013, respectively. The AECO/NYMEX differential experienced short-term hyper-volatility in the third quarter of 2013 as a result of changes to TransCanada's mainline toll structure, which resulted in a lower volume of natural gas being shipped out of Alberta and a significant build in natural gas inventories in western Canada. An increase in firm shipping contracts on the TransCanada mainline and extreme cold weather throughout North America in the fourth quarter of 2013 alleviated the western Canadian natural gas inventory build, narrowing the AECO/NYMEX differential in the fourth quarter of 2013. Over the long-term, demand for natural gas is expected to increase due to the export of liquefied natural gas, increased natural gas power generation, increased exports to Mexico, and increased usage from the transportation and industrial sectors.
During 2013, the Canadian dollar devalued relative to the US dollar, starting the year at parity and ending the year at Cdn$/US$1.06. Subsequent to the fourth quarter, the Canadian dollar fell further to its lowest level since 2009. The strengthening of US dollar relative to the Canadian dollar was attributed to a stronger US economy, in particular higher growth and employment rates in the US, which resulted in easing of the Federal Reserve's financial stimulus program. Given that North American crude oil and natural gas benchmark prices are denominated in US dollars, the strengthening of the US dollar has a positive impact on the revenues received by western Canadian producers. Movement in the Cdn$/US$ exchange rate also impacts the value of ARC's long-term debt given that approximately 82 per cent of ARC's total debt outstanding is denominated in US dollars.
Ongoing commodity price volatility may affect ARC's funds from operations and rates of return on its capital programs. As continued volatility is expected in 2014, ARC will take steps to mitigate these risks and protect its strong financial position.
FINANCIAL REVIEW
Funds from Operations
ARC's fourth quarter funds from operations of $237.8 million ($0.76 per share) were up 14 per cent compared to the fourth quarter of 2012 and full year funds from operations of $861.8 million ($2.76 per share) were up 20 per cent relative to 2012. Higher fourth quarter and full year 2013 funds from operations were attributed to higher production and higher crude oil and natural gas prices, offset in part by higher royalties, transportation and operating costs and lower realized hedging gains. Lower current income tax expense in the fourth quarter and full year 2013 positively impacted funds from operations in 2013 relative to 2012.
The following table details the change in funds from operations for 2013 relative to 2012.
| Three Months Ended | Twelve Months Ended | ||||
| December 31 | December 31 | ||||
| $ millions | $/Share (3) | $ millions | $/Share (3) | ||
| Funds from operations - 2012 (1) | 208.4 | 0.68 | 719.8 | 2.42 | |
| Volume variance | |||||
| Crude oil and liquids | 23.6 | 0.08 | 42.1 | 0.14 | |
| Natural gas | 3.4 | 0.01 | 6.2 | 0.02 | |
| Price variance | |||||
| Crude oil and liquids | 12.8 | 0.04 | 81.9 | 0.27 | |
| Natural gas | 9.8 | 0.03 | 104.7 | 0.34 | |
| Realized gain or loss on risk management contracts | 6.9 | 0.02 | (50.7) | (0.15) | |
| Unrealized gain on risk management contracts related to current production periods (2) | (16.8) | (0.05) | — | — | |
| Royalties | (9.2) | (0.03) | (27.4) | (0.09) | |
| Expenses | |||||
| Transportation | (5.9) | (0.02) | (16.1) | (0.05) | |
| Operating | (8.0) | (0.03) | (16.9) | (0.05) | |
| General and administrative ("G&A") | 2.6 | 0.01 | 1.2 | — | |
| Interest | 0.2 | — | 2.8 | 0.01 | |
| Current tax | 10.0 | 0.03 | 13.6 | 0.04 | |
| Realized gain or loss on foreign exchange | — | — | 0.6 | — | |
| Diluted shares | — | (0.01) | — | (0.14) | |
| Funds from operations - 2013 (1) | 237.8 | 0.76 | 861.8 | 2.76 | |
| (1) | Additional GAAP measure which may not be comparable to similar additional GAAP measures used by other entities. Refer to the section entitled "Additional GAAP Measures" contained in the MD&A for the three and twelve months ended December 31, 2013 and 2012. Also refer to the "Funds from Operations" section in the MD&A for the three and twelve months ended December 31, 2013 and 2012 for a reconciliation of ARC's net income to funds from operations and cash flow from operating activities. |
| (2) | Throughout the year, ARC has applied the portion of gains or losses associated with these contracts to the funds from operations calculation in the production period to which they relate to more appropriately reflect the funds from operations generated during the period after any effects of contracts used for economic hedging. At December 31, all gains and losses associated with these contracts have been realized, and in the fourth quarter gains or losses previously applied to all prior quarters are reversed. |
| (3) | Per share amounts are based on weighted average shares, diluted. |
Operating Netbacks
ARC's fourth quarter 2013 operating netback, before hedging, of $28.34 per boe was six per cent higher than the fourth quarter of 2012. ARC's full year 2013 pre-hedging netback of $28.57 per boe was 18 per cent higher than the comparable period of 2012. After hedging, ARC's fourth quarter and full year 2013 netbacks increased to $28.75 per boe and $29.02 per boe, respectively. Higher 2013 netbacks both before and after hedging, relative to 2012, were primarily due to higher crude oil and natural gas prices in 2013.
ARC's fourth quarter total corporate royalty rate of 14 per cent ($6.42 per boe) increased from 13.4 per cent ($5.71 per boe) in the fourth quarter of 2012 due to higher commodity prices in 2013. ARC's full year total corporate royalty rate was 13.7 per cent, a slight decrease from 14.1 per cent in the comparable period of 2012. Lower royalty rates for the full year 2013 were due to a greater portion of oil production in Alberta qualifying for a five per cent royalty rate.
Fourth quarter operating expenses were $9.21 per boe in 2013, five per cent higher than fourth quarter 2012 operating costs of $8.80 per boe due to additional road maintenance resulting from increased trucking activity and additional costs associated with a turnaround at Redwater which continued into the fourth quarter. Full year 2013 operating costs increased slightly to $9.66 per boe in 2013, compared to $9.40 per boe in 2012 due to higher average electricity rates in 2013 relative to 2012.
Fourth quarter transportation costs increased to $1.83 per boe from $1.26 per boe in the fourth quarter of 2012 and full year 2013 transportation costs increased to $1.72 per boe from $1.29 per boe in 2012. The increase in fourth quarter and full year 2013 transportation costs was primarily due to a higher volume of oil and liquids production being trucked due to certain pipeline restrictions and apportionments.
Risk Management
ARC has hedge contracts in place to protect prices on crude oil volumes through 2014 and natural gas volumes through 2018. Approximately 45 per cent of total production is currently hedged for 2014 at prices that will support ARC's business plan.
Approximately 35 per cent of crude oil and condensate production is currently hedged for 2014 at an average floor/ceiling price of US$91/US$98 per barrel. ARC also has "Sold Floors" on 3,760 barrels per day at an average price of US$70 per barrel in 2014. The "Sold Floors" limit the downside protection and reduce ARC's overall hedging transaction costs.
Approximately 50 per cent of 2014 natural gas production is currently hedged at an average floor/ceiling price of US$4.00/US$4.23 per mmbtu. Additional natural gas production is hedged in 2015 through 2018 at floor prices of US$4.00 per mmbtu to support long-term development economics for ARC's significant natural gas resource base. ARC also has AECO basis swap contracts in place, fixing the AECO price received to approximately 90 per cent of the Henry Hub NYMEX price on a portion of its natural gas volumes for 2014 through 2018.
ARC has an active foreign exchange hedging program to manage the exposure to movements in the Cdn$/US$ exchange rates in relation to US dollar denominated crude oil and natural gas prices. ARC has positions in place for 2014 and 2015 as outlined in the table below.
The following table summarizes ARC's commodity and foreign exchange hedge positions for 2014 through 2018. ARC will continue to pursue opportunities to protect funds from operations and will continue to take positions in natural gas and/or crude oil at levels that will provide greater certainty of future cash flows. For a complete listing and terms of ARC's hedging contracts, see Note 15 "Financial Instruments and Market Risk Management "in the Audited Consolidated Financial Statements for the years ended December 31, 2013 and 2012.
| Hedge Positions Summary (1) | ||||||||||||||||
|
As at February 5, 2014 |
2014 | 2015 | 2016 - 2017 | 2018 | ||||||||||||
| Crude Oil (2) | US$/bbl | bbl/day | US$/bbl | bbl/day | US$/bbl | bbl/day | US$/bbl | bbl/day | ||||||||
| Ceiling | 98.04 | 13,967 | — | — | — | — | — | — | ||||||||
| Floor | 90.88 | 13,967 | — | — | — | — | — | — | ||||||||
| Sold Floor | 70.00 | 3,760 | — | — | — | — | — | — | ||||||||
|
Natural Gas (3) |
US$/mmbtu | mmbtu/day | US$/mmbtu | mmbtu/day | US$/mmbtu | mmbtu/day | US$/mmbtu | mmbtu/day | ||||||||
| Ceiling | 4.23 | 210,000 | 4.82 | 116,027 | 4.95 | 100,000 | 5.00 | 50,000 | ||||||||
| Floor | 4.00 | 210,000 | 4.00 | 116,027 | 4.00 | 100,000 | 4.00 | 50,000 | ||||||||
|
Natural Gas - AECO Basis (4) |
AECO/ NYMEX |
mmbtu/day |
AECO/ NYMEX |
mmbtu/day |
AECO/ NYMEX |
mmbtu/day |
AECO/ NYMEX |
mmbtu/day | ||||||||
| Swap (percentage of NYMEX) | 89.8 | 164,740 | 90.5 | 130,000 | 90.5 | 130,000 | 89.9 | 9,918 | ||||||||
| Foreign Exchange | Cdn$/US$ | US$ Total | Cdn$/US$ | US$ Total | Cdn$/US$ | US$ Total | Cdn$/US$ | US$ Total | ||||||||
| Ceiling | 1.0703 | 552,000 | 1.0725 | 48,000 | — | — | — | — | ||||||||
| Floor | 1.0467 | 552,000 | 1.0463 | 48,000 | — | — | — | — | ||||||||
| (1) | The prices and volumes in this table represent averages for several contracts representing different periods. The average price for the portfolio of options listed above does not have the same payoff profile as the individual option contracts. Viewing the average price of a group of options is purely for indicative purposes. All positions are financially settled against the benchmark prices disclosed in Note 15 "Financial Instruments and Market Risk Management" in the financial statements for the year ended December 31, 2013. |
| (2) | The crude oil prices in this table are referenced to WTI. For 2014, all floor positions settle against the monthly average WTI price, providing protection against monthly volatility. Positions establishing the "ceiling" have been sold against the monthly average WTI price. |
| (3) | The natural gas prices in this table are referenced to NYMEX at Henry Hub. |
| (4) | ARC sells the majority of its natural gas production based on AECO pricing. To reduce the risk of weak basis pricing (AECO relative to NYMEX) ARC has hedged a portion of production by tying ARC's price to a percentage of the NYMEX natural gas price. |
ARC realized net gains of $3.9 million and $15.7 million on its commodity, foreign currency and power hedging program during the fourth quarter and full year 2013, respectively.
OPERATIONAL REVIEW
ARC spent $207.7 million on capital activities, before land and net acquisitions, in the fourth quarter and $859.9 million in the full year 2013, drilling 26 gross operated wells (88 per cent oil and liquids) in the fourth quarter and 167 gross operated wells (92 per cent oil and liquids) in the full year 2013. ARC's fourth quarter and full year 2013 capital program focused on high rate of return oil and liquids development at Ante Creek, Parkland, Tower, Pembina and Goodlands, and low cost high rate of return natural gas development at Dawson and Sunrise.
ARC achieved record fourth quarter and full year average production of 100,883 boe per day and 96,087 boe per day, respectively. This represents production growth of five per cent and three per cent for the fourth quarter and full year 2013 relative to comparable periods of 2012. Higher fourth quarter and full year production was the result of new wells at Ante Creek, Parkland and Tower, and strong well performance at Pembina. ARC's fourth quarter oil and liquids production achieved record levels at 40,990 barrels per day (41 per cent of total production), nine per cent higher than the fourth quarter of 2012. Crude oil and liquids production has increased 19 per cent since 2010 due to a deliberate focus on high value oil and liquids rich gas development which started in 2011.
ARC continued to grow its presence in core areas during 2013 with $50.7 million of spending on land and "tuck-in" acquisitions, predominantly in the Montney and Pembina Cardium regions.
During the fourth quarter, ARC successfully and safely commissioned its new Parkland/Tower gas processing and liquids handling facility and initiated the flow of restricted volumes of oil and natural gas through the facility late in the quarter. ARC also advanced its Sunrise pilot to commercial development, accelerated its Ante Creek drilling program and confirmed plans for production pilots at Attachie and Septimus.
ARC has executed multi-well pad drilling programs in key areas during 2013 and plans to continue with pad drilling programs in 2014. The pad drilling programs are expected to decrease overall per well costs to drill, complete and tie-in, but do result in longer lead time from the start of drilling until the wells commence production, as all drilling and completion activities must be completed on all wells before they are brought on-stream at one time.
Ante Creek
ARC has a land position of 341 net sections at Ante Creek, a Montney oil
and natural gas play in northern Alberta with significant future growth
potential. During 2013, ARC grew its Ante Creek Montney land position
by 76 net sections through tuck-in acquisitions and crown land sales.
With the execution of pad drilling programs, Ante Creek production was relatively flat for the first eight months of 2013, however fourth quarter production increased significantly to 16,200 boe per day (55 per cent oil and liquids) as 11 new wells were brought on-stream. ARC drilled nine gross operated oil wells in the fourth quarter of 2013 for a total of 38 gross operated oil wells drilled in 2013. ARC allocated additional capital to Ante Creek in the fourth quarter to accelerate certain horizontal drilling in response to recent successes in the area. ARC continues to assess infrastructure requirements in conjunction with future development plans for Ante Creek. Additional facilities will be required if ARC increases production much beyond current levels.
During 2013, ARC tested down-spacing potential at Ante Creek on prospective lands that had previously been horizontally drilled and were in close proximity to existing infrastructure. ARC infill drilled 26 wells with 200 meter spacing on three pads during 2013 (40 wells drilled with 200 meter spacing to the end of 2013). Results to date have been promising and ARC expects that the down-spacing will yield higher recoveries and maximize the value of field development.
ARC plans to spend $200 million to drill 40 gross operated horizontal Montney oil wells at Ante Creek in 2014 and continue to delineate this large, prospective land base. ARC expects 2014 production to average in excess of 15,000 boe per day (50 per cent crude oil and liquids), representing an estimated 25 per cent increase relative to 2013 average production
Parkland/Tower
ARC has a land position of 23 net sections at Parkland, a Montney
liquids-rich natural gas play, located in northeastern British
Columbia. ARC's Tower property consists of 57 net sections of
contiguous land north and west of the Parkland field, producing
predominantly light oil and free condensate with additional liquids in
the gas stream; therefore providing favorable economics.
During the fourth quarter, ARC completed construction of its gas processing and liquids handling facility, providing design capacity of approximately 60 mmcf per day of natural gas and 8,000 barrels per day of liquids (5,000 barrels per day of oil and 3,000 barrels per day of NGL's). Actual liquids production will depend upon the ratio of Parkland and Tower wells feeding into the facilities. ARC initiated the flow of restricted volumes of oil and natural gas through the facility late in the fourth quarter of 2013. Upon commissioning of the new facility, ARC had an inventory of 26 previously drilled wells at Tower and Parkland which were tied into the facility and ready to be brought on-stream. The existing wells will be systematically brought on production over the course of the first quarter of 2014 (18 oil and natural gas wells had been brought on-stream by mid-January 2014).
Fourth quarter production for the Parkland/Tower area was approximately 12,500 boe per day (20 per cent crude oil and liquids and 80 per cent natural gas), up 42 per cent from the fourth quarter of 2012 and 22 per cent higher than the third quarter of 2013. Higher production was attributed to restricted initial production from new wells that were brought on-stream through the new facility and restricted oil production from the first eight well pad at Tower, which was producing to tanks prior to the new facility being commissioned. ARC drilled two gross operated liquids-rich natural gas wells at Parkland during the fourth quarter for a total of 15 gross operated liquids rich natural gas wells drilled in 2013. At Tower, ARC drilled 13 oil wells in 2013.
ARC plans to execute a $190 million capital program at Parkland/Tower in 2014 to drill 13 liquids-rich natural gas wells at Parkland and 17 oil wells at Tower to partially fill the new facility. ARC expects approximately 100 per cent annual growth at Parkland/Tower with production expected to average 20,000 boe per day in 2014 (approximately 90 mmcf per day of natural gas and 5,000 barrels per day of crude oil and liquids). All drilling at Parkland/Tower will be on pads with four to eight wells per pad. Over the course of 2014 and into 2015, Parkland/Tower production will increase as new wells come on-stream, utilizing the new processing facility.
Pembina
Pembina Cardium production continues to exceed expectations with strong
well performance resulting in fourth quarter production of
approximately 12,400 boe per day (83 per cent light oil and liquids).
ARC's Pembina assets are now more heavily weighted to high value, high
netback Cardium oil and liquids production following the divestment of
approximately 1,600 boe per day (approximately 78 per cent natural gas)
of non-core assets during the third quarter of 2013. During 2013, ARC
expanded its land base at Pembina, adding six net sections of Cardium
lands. ARC drilled 39 gross operated horizontal Cardium oil wells at
Pembina during 2013.
ARC continued with the testing of two horizontal water injection pilot projects at Pembina. Results to date from the pilot projects indicate that the waterflood management is contributing incremental oil to more than offset base declines at producing wells in the area.
ARC plans to spend approximately $120 million in the Pembina area in 2014 with plans to drill 44 gross operated horizontal Cardium oil wells. ARC expects to maintain production at current levels of approximately 12,000 boe per day through 2014. ARC's deliberate, paced development program at Pembina is aimed at managing production declines in this area, while generating significant free cash flow. ARC will continue with extensive work on waterflood management at Pembina in 2014 to optimize reservoir recoveries.
Dawson
ARC's Dawson Montney play is the foundation of ARC's profitable low cost
natural gas business. Dawson production averaged 159 mmcf per day of
natural gas and 1,000 barrels per day of condensate and liquids during
the fourth quarter of 2013. Dawson continues to perform well,
delivering robust economics and significant cash flow at current
natural gas prices due to exceptional well results, excellent capital
efficiencies and low operating costs. During 2013, ARC drilled nine
gross operated natural gas wells at Dawson.
ARC plans to invest $54 million on drilling and development activities at Dawson in 2014, drilling nine gross operated horizontal natural gas wells on two pads. The 2014 drilling program at Dawson will maintain production at current maximum facility capacity levels through 2014 and into 2015.
Sunrise
At Sunrise, a natural gas Montney play in northeastern British Columbia,
ARC has a land position of 24 net sections. The Sunrise property has a
significant natural gas resource base, low capital and operating costs,
and potential for multi-layer development, resulting in high rates of
return even at relatively low natural gas prices. ARC has been
piloting production at Sunrise since the third quarter of 2011 through
third party facilities. Fourth quarter 2013 Sunrise production was
approximately 21 mmcf per day of natural gas production coming from
three layers of the Montney.
With the continued strong performance of the wells and the current outlook for commodity prices, ARC drilled two horizontal wells in the fourth quarter of 2013, a precursor to a full-scale developmental drilling and infrastructure program planned for 2014 and 2015. ARC entered into an agreement with a third party to increase natural gas processing commitments to 60 mmcf per day commencing in 2014. ARC is proceeding with the construction of an ARC operated 60 mmcf per day gas processing facility which is scheduled to be on-stream by late 2015. ARC has commenced initial engineering, design and field studies for the new facility and expects to break ground in early 2015.
ARC's 2014 capital program of $120 million includes the drilling of 14 gross operated natural gas wells and spending on associated infrastructure at Sunrise in 2014. ARC expects Sunrise production to grow from 20 mmcf per day to 60 mmcf per day throughout the course of 2014, averaging approximately 35 mmcf per day in 2014, representing a greater than 90 per cent year-over-year increase in production. The 2014 capital program includes some pre-spending for long lead equipment and supplies in relation to the new gas processing facility construction.
Southeast Saskatchewan and Manitoba
Fourth quarter production in this region averaged approximately 11,600
boe per day of light oil. ARC drilled seven gross operated oil wells
in southeast Saskatchewan and Manitoba during the fourth quarter of
2013 (48 gross operated wells drilled in 2013).
ARC plans to spend $130 million to drill 51 gross operated oil wells in southeast Saskatchewan and Manitoba at various properties. ARC expects to hold production flat at approximately 12,000 boe per day in 2014. This region contributes high quality, high netback crude oil and generates significant cash flow to fund development opportunities throughout ARC's asset base.
Attachie
At Attachie, an oil and liquids-rich natural gas Montney play located in
northeast British Columbia, ARC has a land position of 143 net
sections. Prior to 2013, ARC had drilled and tested four horizontal
wells, the 4-20 horizontal well on the western portion of the lands and
three wells on the eastern portion of the lands.
During the fourth quarter of 2013, ARC drilled one gross operated horizontal well (the 16-16 well) offsetting the 4-20 well and entered into a processing agreement with a third party to initiate pilot production from the two wells on the western portion of the lands.
ARC will evaluate production from the wells on the western portion of the Attachie lands to determine the potential for future commercial development at Attachie.
Septimus
At Septimus, a liquids-rich natural gas Montney play located in
northeast British Columbia, ARC has a land position of 22 net
sections. Prior to 2013, ARC had drilled and tested one horizontal
well at Septimus. The A13-11 well tested at a rate of 11.5 mmcf per
day of natural gas and 24 barrels per mmcf of liquids at a flowing
casing pressure of 8.4 MPa after a five day production test in 2011.
During the fourth quarter of 2013, ARC entered into a processing
agreement with a third party to initiate pilot production at Septimus.
ARC will evaluate pilot production to determine the potential for future commercial development at Septimus.
DIVIDENDS
ARC paid dividends totaling $0.30 per share for the fourth quarter of
2013. The Board of Directors has confirmed a dividend of $0.10 per
share for January 2014, payable on February 18, 2014, and has
conditionally declared a monthly dividend of $0.10 per share for
February 2014 through April 2014 payable as follows:
| Ex-dividend date | Record date | Payment date | Per share amount |
| January 29, 2014 | January 31, 2014 | February 18, 2014 | $0.10 (1) |
| February 26, 2014 | February 28, 2014 | March 17, 2014 | $0.10 (2) |
| March 27, 2014 | March 31, 2014 | April 15, 2014 | $0.10 (2) |
| April 28, 2014 | April 30, 2014 | May 15, 2014 | $0.10 (2) |
| (1) | Confirmed on January 16, 2014. |
| (2) | Conditionally declared, subject to confirmation by news release and further resolution by the Board of Directors. |
ARC's shareholders may receive dividend payments in the form of cash or may elect to receive dividend payments in the form of common shares through the company's Stock Dividend Program ("SDP"). Shareholders may reinvest cash dividends into additional common shares of ARC through the Dividend Reinvestment Plan ("DRIP"). Participation in the SDP or DRIP is optional. Shareholders will continue to receive dividend payments in cash unless they choose to participate in the SDP or DRIP. Shareholders, wherever resident, are encouraged to consult their own tax advisors regarding the tax consequences to them of receiving cash or stock dividends.
During 2013, ARC declared dividends of $374.0 million, of which $14.7 million was issued in the form of common shares under the SDP and $115.9 million was reinvested into ARC shares through the DRIP. Proceeds received from the DRIP and reduced cash dividend payments resulting from shares issued under the SDP are a source of funding for ARC's capital programs.
For additional details regarding the SDP and DRIP including terms, eligibility, and enrollment procedures, please see our website at www.arcresources.com.
The dividends have been designated as eligible dividends under the Income Tax Act (Canada). The declaration of the dividends is conditional upon confirmation by news release and is subject to any further resolution of the Board of Directors. Dividends are subject to change in accordance with ARC's dividend policy depending on a variety of factors and conditions existing from time-to-time, including fluctuations in commodity prices, production levels, capital expenditure requirements, debt service requirements, operating expenses, royalty burdens, foreign exchange rates and the satisfaction of solvency tests imposed by the Business Corporations Act (Alberta) for the declaration and payment of dividends.
See "Outlook" for additional discussion regarding Dividends.
OUTLOOK
The foundation of ARC's business strategy is "risk-managed value creation". High quality assets, operational excellence, financial strength, and top talent are the key principles underpinning ARC's business strategy. ARC's goal is to create shareholder value in the form of regular dividends and anticipated capital appreciation relating to future growth.
ARC is focused on value creation, with the dividend being a key component of our business strategy. We believe that we are well positioned to sustain current dividend levels despite the volatile commodity price environment. ARC's dividend payout ratio was 40 per cent and 43 per cent of funds from operations for the fourth quarter and full year 2013, respectively, a level which we believe is reasonable given the current commodity price environment. Going forward, as we grow our production and funds from operations, we expect that our dividend payout ratio will naturally decline to a level that provides even greater financial flexibility. Our business model is dynamic and we continually assess dividend levels and capital spending in light of current and forecast market conditions.
ARC executed a strong capital program in 2013, spending $874.2 million (including crown land spending) with a focus on oil and liquid-rich gas development, low cost natural gas development and infrastructure spending to facilitate future growth. ARC achieved fourth quarter and full year average record production levels, delivering three per cent growth in annual average production, and growing high value crude oil and liquids production to record levels. ARC grew its presence in the Montney to 899 net sections with the acquisition of 175 net sections of land in 2013, primarily at Ante Creek and Attachie. ARC's Montney landholdings present significant future opportunity for growth in reserves and production given the large inventory of undeveloped land. During 2013, ARC divested of certain non-core gas weighted assets, yielding proceeds of approximately $90 million, further strengthening ARC's balance sheet which in turn was used to partially fund ARC's 2013 capital program.
ARC plans to execute a $915 million capital budget in 2014 with a continued focus on oil and liquids-rich gas development to capitalize on the strength of crude oil prices and natural gas development spending in low cost, high rate of return natural gas projects. ARC expects 2014 production to be in the range of 110,000 to 114,000 boe per day, representing significant year-over-year production growth relative to 2013 levels. A significant portion of the 2014 production growth will come from the Parkland/Tower area with the start-up of the new 60 mmcf per day gas processing and liquids handling facility in late 2013. ARC will pursue the most cost effective means of financing its 2014 capital program through a combination of funds from operations, DRIP proceeds, reduced cash dividend payments resulting from shares issued under the SDP, existing credit facilities, and proceeds from potential non-core property dispositions. The 2014 planned capital program excludes unbudgeted amounts for the acquisition of land and small producing properties.
ARC's full year 2014 guidance estimates are outlined in the following table.
| 2013 Guidance | 2013 Actual | % Variance | 2014 Guidance (3) | ||
| Production | |||||
| Oil (bbl/d) | 32,000 - 33,000 | 32,784 | — | 35,000 - 37,000 | |
| Condensate (bbl/d) | 1,900 - 2,100 | 2,251 | 7 | 2,300 - 2,500 | |
| Gas (mmcf/d) | 345 - 355 | 349.4 | — | 415 - 425 | |
| NGLs (bbl/d) | 2,800 - 3,000 | 2,811 | — | 3,700 - 4,000 | |
| Total (boe/d) | 94,000 - 97,000 | 96,087 | — | 110,000 - 114,000 | |
| Expenses ($/boe) | |||||
| Operating | 9.50 - 9.70 | 9.66 | — | 9.20 - 9.60 | |
| Transportation | 1.40 - 1.50 | 1.72 | 15 | 1.70 - 1.80 | |
| G&A (1) | 2.50 - 2.70 | 2.77 | 3 | 2.20 - 2.40 | |
| Interest | 1.20 - 1.30 | 1.21 | — | 1.10 - 1.20 | |
| Current income tax ($ millions) | 25 - 35 | 16.3 | (35) | 60 - 70 | |
| Capital expenditures before land purchases and net property dispositions ($ millions) (2) | 860 | 859.9 | — | 915 | |
| Land purchases and net property dispositions ($ millions) | — | (39.1) | N/A | - | |
| Weighted average shares, diluted (millions) | 311 | 312 | — | 317 | |
| (1) | The 2013 guidance for G&A expenses per boe was based on a range of $1.75 - $1.90 prior to the recognition of any expense associated with ARC's long-term incentive plans and $0.75 - $0.80 per boe associated with ARC's long-term incentive plans. Actual per boe costs for each of these components for the year ended December 31, 2013 were $1.67 per boe and $1.10 per boe, respectively. |
| (2) |
Excludes amounts related to unbudgeted land purchases and net
dispositions of small producing properties which totaled $39.1 million
in 2013. |
| (3) | 2014 production guidance does not take into account the impact of any dispositions that may occur during the year. |
Transportation expenses exceeded guidance due to increased trucking activity during 2013 attributed to higher crude oil and liquids production and certain crude oil and liquids pipeline constraints. G&A expense slightly exceeded guidance as a result of increased LTIP costs associated with ARC's higher share price in 2013. Current income tax expense was lower than guidance primarily due to the acceleration of certain deductions for capital expenditures incurred in the year and the recognition of certain investment tax credits in the filing of ARC's 2012 income tax return and to be filed in its 2013 income tax return.
|
ARC RESOURCES LTD. |
||||
| CONSOLIDATED BALANCE SHEETS (unaudited) | ||||
| (Cdn$ millions) | December 31, 2013 | December 31, 2012 | ||
| ASSETS | ||||
| Current assets | ||||
| Cash and cash equivalents | — | 194.6 | ||
| Short-term investment | 3.6 | 1.7 | ||
| Accounts receivable | 176.5 | 164.3 | ||
| Prepaid expenses | 15.6 | 13.1 | ||
| Risk management contracts | 4.4 | 30.9 | ||
| Assets held for sale | — | 0.3 | ||
| 200.1 | 404.9 | |||
| Reclamation fund | 32.6 | 29.8 | ||
| Risk management contracts | 61.2 | 1.7 | ||
| Intangible exploration and evaluation assets | 265.4 | 238.1 | ||
| Property, plant and equipment | 4,928.5 | 4,704.4 | ||
| Goodwill | 248.2 | 248.2 | ||
| Total assets | 5,736.0 | 5,627.1 | ||
| LIABILITIES | ||||
| Current liabilities | ||||
| Accounts payable and accrued liabilities | 274.5 | 301.0 | ||
| Current portion of long-term debt | 42.1 | 39.7 | ||
| Current portion of asset retirement obligations | 25.1 | — | ||
| Dividends payable | 31.4 | 30.9 | ||
| Risk management contracts | 12.9 | 0.5 | ||
| Liabilities associated with assets held for sale | — | 1.3 | ||
| 386.0 | 373.4 | |||
| Risk management contracts | 0.6 | 10.3 | ||
| Long-term debt | 859.2 | 747.7 | ||
| Long-term incentive compensation liability | 26.1 | 24.5 | ||
| Other deferred liabilities | 17.5 | 19.3 | ||
| Asset retirement obligations | 450.3 | 532.9 | ||
| Deferred taxes | 600.2 | 522.3 | ||
| Total liabilities | 2,339.9 | 2,230.4 | ||
| SHAREHOLDERS' EQUITY | ||||
| Shareholders' capital | 3,800.8 | 3,670.2 | ||
| Contributed surplus | 3.8 | 1.7 | ||
| Deficit | (408.5) | (275.2) | ||
| Total shareholders' equity | 3,396.1 | 3,396.7 | ||
| Total liabilities and shareholders' equity | 5,736.0 |
5,627.1 |
||
| ARC RESOURCES LTD. | ||||||||
| CONSOLIDATED STATEMENTS OF INCOME AND COMPREHENSIVE INCOME (unaudited) | ||||||||
| For the three and twelve months ended December 31 | ||||||||
| Three Months Ended | Twelve months ended | |||||||
| December 31 | December 31 | |||||||
| (Cdn$ millions, except per share amounts) | 2013 | 2012 | 2013 | 2012 | ||||
| REVENUE | ||||||||
| Sales of crude oil, natural gas, condensate, natural gas liquids and other income | 425.0 | 375.4 | 1,624.3 | 1,389.4 | ||||
| Royalties | (59.5) | (50.3) | (223.1) | (195.7) | ||||
| 365.5 | 325.1 | 1,401.2 | 1,193.7 | |||||
| Gain (loss) on risk management contracts | (18.9) | 55.6 | 46.3 | 80.6 | ||||
| 346.6 | 380.7 | 1,447.5 | 1,274.3 | |||||
| EXPENSES | ||||||||
| Transportation | 17.0 | 11.1 | 60.2 | 44.1 | ||||
| Operating | 85.5 | 77.5 | 338.7 | 321.8 | ||||
| Intangible exploration and evaluation expenses | 1.3 | — | 1.3 | — | ||||
| General and administrative | 24.3 | 26.4 | 97.1 | 97.1 | ||||
| Interest and financing charges | 11.3 | 11.5 | 42.5 | 45.3 | ||||
| Accretion of asset retirement obligations | 3.1 | 3.1 | 12.5 | 12.4 | ||||
| Depletion, depreciation, amortization and impairment | 157.0 | 133.2 | 551.9 | 571.1 | ||||
| Loss (gain) on foreign exchange | 24.8 | 8.3 | 49.2 | (7.3) | ||||
| (Gain) loss on short-term investment | (0.4) | (0.3) | (1.9) | 1.6 | ||||
| Gain on disposal of petroleum and natural gas properties | 0.4 | — | (38.9) | (0.2) | ||||
| 324.3 | 270.8 | 1,112.6 | 1,085.9 | |||||
| Provision for (recovery of) income taxes | ||||||||
| Current | (6.4) | 3.6 | 16.3 | 29.9 | ||||
| Deferred | 15.1 | 21.8 | 77.9 | 19.3 | ||||
| 8.7 | 25.4 | 94.2 | 49.2 | |||||
| Net income and comprehensive income | 13.6 | 84.5 | 240.7 | 139.2 | ||||
| Net income per share | ||||||||
| Basic | 0.04 | 0.27 | 0.77 | 0.47 | ||||
| Diluted | 0.04 | 0.27 | 0.77 | 0.47 | ||||
| ARC RESOURCES LTD. | ||||||||
| CONSOLIDATED STATEMENTS OF CHANGES IN SHAREHOLDERS' EQUITY (unaudited) | ||||||||
| For the years ended December 31 | ||||||||
| (Cdn$ millions) |
Shareholders' Capital |
Contributed Surplus |
Deficit |
Total Shareholders' Equity |
||||
| December 31, 2011 | 3,218.3 | 0.5 | (57.0) | 3,161.8 | ||||
| Shares issued for cash | 346.2 | — | — | 346.2 | ||||
| Shares issued pursuant to the dividend reinvestment program | 116.3 | — | — | 116.3 | ||||
| Share issue costs (1) | (10.6) | — | — | (10.6) | ||||
| Share option expense | — | 1.2 | — | 1.2 | ||||
| Comprehensive income | — | — | 139.2 | 139.2 | ||||
| Dividends declared | — | — | (357.4) | (357.4) | ||||
| December 31, 2012 | 3,670.2 | 1.7 | (275.2) | 3,396.7 | ||||
| Shares issued for cash | 0.5 | — | — | 0.5 | ||||
| Shares issued pursuant to the dividend reinvestment program | 115.4 | — | — | 115.4 | ||||
| Shares issued pursuant to the stock dividend program | 14.7 | — | — | 14.7 | ||||
| Share option expense | — | 2.1 | — | 2.1 | ||||
| Comprehensive income | — | — | 240.7 | 240.7 | ||||
| Dividends declared | — | — | (374.0) | (374.0) | ||||
| December 31, 2013 | 3,800.8 | 3.8 | (408.5) | 3,396.1 | ||||
| (1) | Amount is net of deferred tax recovery of $3.7 million. |
| ARC RESOURCES LTD. | ||||||||
| CONSOLIDATED STATEMENTS OF CASH FLOWS (unaudited) | ||||||||
| For the three and twelve months ended December 31 | ||||||||
| Three Months Ended | Twelve Months Ended | |||||||
| December 31 | December 31 | |||||||
| (Cdn$ millions) | 2013 | 2012 | 2013 | 2012 | ||||
| CASH FLOW FROM OPERATING ACTIVITIES | ||||||||
| Net income and comprehensive income | 13.6 | 84.5 | 240.7 | 139.2 | ||||
| Add items not involving cash: | ||||||||
| Unrealized loss (gain) on risk management contracts | 27.8 | (53.6) | (30.6) | (14.2) | ||||
| Accretion of asset retirement obligations | 3.1 | 3.1 | 12.5 | 12.4 | ||||
| Depletion, depreciation, amortization and impairment | 157.0 | 133.2 | 551.9 | 571.1 | ||||
| td> | Intangible exploration and evaluation expenses | 1.3 | — | 1.3 | — | |||
| Unrealized loss (gain) on foreign exchange | 24.8 | 8.3 | 48.9 | (8.2) | ||||
| Gain on disposal of petroleum and natural gas properties | 0.4 | — | (38.9) | (0.2) | ||||
| Deferred tax expense | 15.1 | 21.8 | 77.9 | 19.3 | ||||
| Other | (0.3) | (0.7) | (1.9) | 0.4 | ||||
| Net change in other liabilities | (2.3) | (2.0) | (16.6) | (10.6) | ||||
| Change in non-cash working capital | (19.6) | (12.0) | (43.5) | (5.7) | ||||
| 220.9 | 182.6 | 801.7 | 703.5 | |||||
| CASH FLOW FROM FINANCING ACTIVITIES | ||||||||
| Issue (repayment) of long-term debt under revolving credit facilities, net | 105.9 | (2.1) | 105.9 | (324.2) | ||||
| Issue of senior notes | — | — | — | 397.8 | ||||
| Repayment of senior notes | (10.0) | (9.3) | (40.9) | (39.6) | ||||
| Issue of common shares | — | 0.4 | 0.5 | 346.2 | ||||
| Share issue costs | — | (0.2) | — | (14.3) | ||||
| Cash dividends paid | (60.8) | (60.0) | (243.4) | (239.1) | ||||
| 35.1 | (71.2) | (177.9) | 126.8 | |||||
| CASH FLOW FROM INVESTING ACTIVITIES | ||||||||
| Acquisition of petroleum and natural gas properties | (12.4) | (2.2) | (36.4) | (33.7) | ||||
| Disposals of petroleum and natural gas properties | (0.5) | 0.3 | 89.8 | 1.1 | ||||
| Property, plant and equipment development expenditures | (200.6) | (179.5) | (859.2) | (557.3) | ||||
| Intangible exploration and evaluation expenditures | (10.6) | (10.7) | (15.0) | (50.4) | ||||
| Net reclamation fund contributions | (1.1) | (1.3) | (2.8) | (2.8) | ||||
| Change in non-cash working capital | (36.9) | 43.8 | 5.2 | 6.9 | ||||
| (262.1) | (149.6) | (818.4) | (636.2) | |||||
| (DECREASE) INCREASE IN CASH AND CASH EQUIVALENTS | (6.1) | (38.2) | (194.6) | 194.1 | ||||
| CASH AND CASH EQUIVALENTS, BEGINNING OF PERIOD | 6.1 | 232.8 | 194.6 | 0.5 | ||||
| CASH AND CASH EQUIVALENTS, END OF PERIOD | — | 194.6 | — | 194.6 | ||||
| The following are included in cash flow from operating activities: | ||||||||
| Income taxes paid in cash | 0.9 | — | 43.6 | — | ||||
| Interest paid in cash | 10.4 | 10.9 | 42.5 | 30.0 | ||||
Forward-looking Information and Statements
This news release contains certain forward-looking information and statements within the meaning of applicable securities laws. The use of any of the words "expect", "anticipate", "continue", "estimate", "objective", "ongoing", "may", "will", "project", "should", "believe", "plans", "intends", "strategy" and similar expressions are intended to identify forward-looking information or statements. In particular, but without limiting the foregoing, this news release contains forward-looking information and statements pertaining to the following: guidance as to the capital expenditure plans of ARC and its future production under the heading "Financial and Operational Highlights", as to its views on the effect of commodity prices under the heading "Economic Environment", as to its operating costs under the heading "Operating Netbacks", as to its risk management plans for 2014 and beyond under the heading "Risk Management", as to its production, exploration and development plans for 2014 and beyond under the heading "Operational Review", and all matters including 2014 guidance under the heading "Outlook".
The forward-looking information and statements contained in this news release reflect material factors and expectations and assumptions of ARC including, without limitation: that ARC will continue to conduct its operations in a manner consistent with past operations; the general continuance of current industry conditions; the continuance of existing (and in certain circumstances, the implementation of proposed) tax, royalty and regulatory regimes; the accuracy of the estimates of ARC's reserves and resource volumes; certain commodity price and other cost assumptions; and the continued availability of adequate debt and equity financing and funds from operations to fund its planned expenditures. ARC believes the material factors, expectations and assumptions reflected in the forward-looking information and statements are reasonable but no assurance can be given that these factors, expectations and assumptions will prove to be correct.
The forward-looking information and statements included in this news release are not guarantees of future performance and should not be unduly relied upon. Such information and statements involve known and unknown risks, uncertainties and other factors that may cause actual results or events to differ materially from those anticipated in such forward-looking information or statements including, without limitation: changes in commodity prices; changes in the demand for or supply of ARC's products; unanticipated operating results or production declines; changes in tax or environmental laws, royalty rates or other regulatory matters; changes in development plans of ARC or by third party operators of ARC's properties, increased debt levels or debt service requirements; inaccurate estimation of ARC's oil and gas reserve and resource volumes; limited, unfavorable or a lack of access to capital markets; increased costs; a lack of adequate insurance coverage; the impact of competitors; and certain other risks detailed from time to time in ARC's public disclosure documents (including, without limitation, those risks identified in this news release and in ARC's Annual Information Form).
The forward-looking information and statements contained in this news release speak only as of the date of this news release, and none of ARC or its subsidiaries assumes any obligation to publicly update or revise them to reflect new events or circumstances, except as may be required pursuant to applicable laws.
ARC Resources Ltd. ("ARC") is one of Canada's largest conventional oil and gas companies with an enterprise value of approximately $10 billion. ARC expects 2014 oil and gas production to average 110,000 to 114,000 barrels of oil equivalent per day from its properties in western Canada. ARC's Common Shares trade on the TSX under the symbol ARX.
ARC RESOURCES LTD.
Myron M. Stadnyk
President and Chief Executive Officer
SOURCE ARC Resources Ltd.
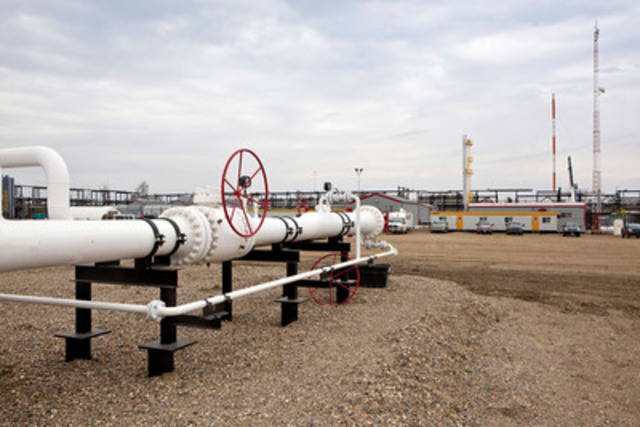
Image with caption: "ARC Resources new Parkland/Tower Gas Processing and Liquids Handling Facility commissioned in Q4 2013. (CNW Group/ARC Resources Ltd.)". Image available at: http://photos.newswire.ca/images/download/20140205_C7665_PHOTO_EN_36334.jpg
