ARC Resources Ltd. announces sixth consecutive year of 200 per cent or greater produced reserves replacement in 2013
Feb 5, 2014
")
CALGARY, Feb. 5, 2014 /CNW/ - (ARX - TSX) ARC Resources Ltd. ("ARC") released today its 2013 year-end reserves and resources information.
"I am really pleased with our team's performance again this year. We added significant reserves at a low finding cost through the drill bit and continued to convert our large reserve and resource base into production and cash flow," stated Myron Stadnyk, President and CEO.
HIGHLIGHTS
-
Replaced approximately 200 per cent of 2013 total production, adding
68.4 mmboe of proved plus probable ("2P") reserves.
-
2P reserves increased four per cent to 634 mmboe, comprised of 2.6 Tcf
of natural gas and 194 mmbbls of crude oil and natural gas liquids
("NGL's") at year-end 2013.
-
Replaced 180 per cent of 2013 crude oil and NGL's production, adding 25
mmbbls of 2P crude oil and NGL's reserves. ARC's crude oil and liquids
development resulted in a four per cent increase in 2P crude oil and
NGL's reserves from 186 mmbbls to 194 mmbbls.
-
Finding and Development costs ("F&D") of $12.79 per boe for 2P reserves
and $17.45 per boe for proved reserves excluding changes in Future
Development Capital ("FDC"). ARC's three year average F&D costs for 2P
reserves were $8.24 per boe, excluding changes in FDC. ARC's 2013
capital development program focused significantly on oil and liquids
development which typically carries higher finding and development
costs, while yielding higher returns given the current commodity price
environment.
-
ARC's 2P RLI has decreased to 15.5 years from 17.5 years and the Future
Development Cost to develop our reserves has declined to $3.3 billion
from $3.4 billion at year-end 2012. Both are the result of significant
capital being spent in 2013, which is expected to increase production
to a range of approximately 110,000 to 114,000 boe per day in 2014. The
reduction in FDC is also partially attributable to capital efficiencies
recognized through pad drilling and longer horizontal wells.
-
Including changes in FDC, ARC's 2P F&D was $11.47 for 2013 and $12.01
for the trailing three year average. Proved F&D including changes in
FDC, was $18.11 for 2013 and averaged $17.42 for the three year
average.
-
Recycle ratio of 2.2 times and 3.3 times for the current year and three
year average, respectively, for 2P reserves based on current and three
year average F&D costs, before changes in FDC, and based on 2013 and
three year average netbacks of $28.57 per boe and $27.24 per boe,
respectively.
- ARC updated an Independent Resources Evaluation ("Resources Evaluation" or "Independent Resources Evaluation") for its Montney lands in the northeast British Columbia ("NE B.C.") Montney region. The updated evaluation reaffirmed the significant resource base on ARC's NE B.C. Montney lands of 55.1 Tcf of natural gas resource (10 per cent increase relative to 50.1 Tcf in 2012) and 2.2 billion barrels of oil resource (50 per cent increase relative to the 1.5 billion barrels in 2012).
2013 INDEPENDENT RESERVES EVALUATION
GLJ conducted an independent reserves evaluation effective December 31, 2013 and prepared in accordance with definitions, standards and procedures contained in the Canadian Oil and Gas Evaluation Handbook ("COGE Handbook") and NI 51-101. The reserves evaluation was based on GLJ forecast pricing and foreign exchange rates at January 1, 2014 as outlined in Table 1 below.
Reserves included herein are stated on a company gross basis (working interest before deduction of royalties without including any royalty interests) unless noted otherwise. All reserves information has been prepared in accordance with National Instrument ("NI") 51-101. This news release contains several cautionary statements that are specifically required by NI 51-101 under the heading "Information Regarding Disclosure on Oil and Gas Reserves, Resources and Operational Information". In addition to the detailed information disclosed in this news release more detailed information will be included in ARC's Annual Information Form ("AIF").
Based on this independent reserves evaluation, ARC's reserve profile as at December 31, 2013 is summarized below:
- ARC's year-end 2013 2P reserves increased four per cent to 634 mmboe compared to 607 mmboe of 2P reserves recorded at year-end 2012
- 2P reserve additions from exploration and development activities (including revisions) were 68.4 mmboe while 6.7 mmboe was divested (net of minor acquisitions), bringing the total additions to 61.7 mmboe before 2013 production of 34.8 mmboe
- The 68.4 mmboe 2P reserves additions from development activities represents approximately 200 per cent of the 34.8 mmboe produced during 2013
- Proved developed producing reserves represent 56 per cent of total proved reserves and 33 per cent of 2P reserves
- Total proved reserves account for 59 per cent of 2P reserves
- Crude oil and NGL's comprise 31 per cent of 2P reserves and natural gas comprises 69 per cent of 2P reserves on a 6:1 boe conversion basis
-
Positive technical revisions of 21 mmboe mainly from the Sunrise,
Dawson, Pembina, and Redwater fields illustrate the strength of ARC's
asset base
| Table 1 | ||||
|
GLJ January 1, 2014 Price Forecast |
West Texas Intermediate Crude Oil ($US/bbl) |
Edmonton Light Crude Oil ($Cdn/bbl) |
Natural Gas at AECO ($Cdn/mmbtu) |
Foreign Exchange ($US/$Cdn) |
| 2014 | 97.50 | 92.76 | 4.03 | 0.95 |
| 2015 | 97.50 | 97.37 | 4.26 | 0.95 |
| 2016 | 97.50 | 100.00 | 4.50 | 0.95 |
| 2017 | 97.50 | 100.00 | 4.74 | 0.95 |
| 2018 | 97.50 | 100.00 | 4.97 | 0.95 |
| 2019 | 97.50 | 100.00 | 5.21 | 0.95 |
| 2020 | 98.54 | 100.77 | 5.33 | 0.95 |
| 2021 | 100.51 | 102.78 | 5.44 | 0.95 |
| 2022 | 102.52 | 104.83 | 5.55 | 0.95 |
| 2023 | 104.57 | 106.93 | 5.66 | 0.95 |
| Escalate thereafter at | +2.0%/yr | +2.0%/yr | +2.0%/yr | 0.95 |
|
Table 2 |
|||||||
| RESERVES SUMMARY |
Light and Medium Crude Oil (mbbl) |
Heavy Crude Oil (mbbl) |
Total Crude Oil (mbbl) |
NGLs (mbbl) |
Natural Gas (Bcf) |
Oil Equivalent 2013 (mboe) |
Oil Equivalent 2012 (mboe) |
| Company Gross | |||||||
| Proved Producing | 88,620 | 1,503 | 90,123 | 11,074 | 644 | 208,454 | 201,019 |
| Proved Developed Non-producing | 2,584 | 78 | 2,662 | 847 | 23 | 7,383 | 12,044 |
| Proved Undeveloped | 17,690 | 105 | 17,795 | 9,462 | 785 | 158,139 | 150,841 |
| Total Proved | 108,894 | 1,686 | 110,580 | 21,383 | 1,452 | 373,976 | 363,904 |
| Proved plus Probable | 153,028 | 2,154 | 155,182 | 38,882 | 2,639 | 633,864 | 606,982 |
|
Table 3 |
||||||||||||
| RESERVES RECONCILIATION COMPANY GROSS | ||||||||||||
|
Light and Medium Crude Oil (mbbl) |
Heavy Crude Oil (mbbl) |
Total Crude Oil (mbbl) |
NGLs (mbbl) |
Natural Gas (mmcf) |
Oil Equivalent (mboe) |
|||||||
| PROVED PRODUCING | ||||||||||||
| Opening Balance | 88,539 | 1,739 | 90,278 | 9,578 | 606,975 | 201,019 | ||||||
| Exploration Discoveries | 0 | 0 | 0 | 1 | 30 | 6 | ||||||
| Extensions and Improved Recovery(1) | 10,510 | 94 | 10,604 | 2,714 | 122,657 | 33,761 | ||||||
| Technical Revisions | 2,462 | -88 | 2,374 | 1,353 | 60,204 | 13,761 | ||||||
| Acquisitions | 58 | 0 | 58 | 4 | 77 | 75 | ||||||
| Dispositions | -1,381 | -11 | -1,392 | -744 | -19,045 | -5,310 | ||||||
| Economic Factors | -6 | -11 | -17 | 7 | -564 | -104 | ||||||
| Production | -11,562 | -220 | -11,782 | -1,839 | -126,795 | -34,754 | ||||||
| Closing Balance | 88,620 | 1,503 | 90,123 | 11,074 | 643,539 | 208,453 | ||||||
| TOTAL PROVED | ||||||||||||
| Opening Balance | 105,255 | 1,739 | 106,994 | 20,214 | 1,420,174 | 363,904 | ||||||
| Exploration Discoveries | 0 | 0 | 0 | 0 | 0 | 0 | ||||||
| Extensions and Improved Recovery (1) | 14,009 | 277 | 14,286 | 2,678 | 88,094 | 31,646 | ||||||
| Technical Revisions | 2,421 | -88 | 2,333 | 1,084 | 94,552 | 19,176 | ||||||
| Acquisitions | 58 | 0 | 58 | 4 | 77 | 75 | ||||||
| Dispositions | -1,409 | -11 | -1,420 | -752 | -19,101 | -5,356 | ||||||
| Economic Factors | 122 | -11 | 111 | -6 | -4,921 | -715 | ||||||
| Production | -11,562 | -220 | -11,782 | -1,839 | -126,795 | -34,754 | ||||||
| Closing Balance | 108,894 | 1,686 | 110,580 | 21,383 | 1,452,079 | 373,976 | ||||||
| PROVED PLUS PROBABLE | ||||||||||||
| Opening Balance | 146,442 | 2,256 | 148,698 | 36,850 | 2,528,603 | 606,982 | ||||||
| Exploration Discoveries | 0 | 0 | 0 | 0 | 0 | 0 | ||||||
| Extensions and Improved Recovery(1) | 18,373 | 99 | 18,472 | 4,755 | 145,069 | 47,405 | ||||||
| Technical Revisions | 1,436 | 47 | 1,483 | 107 | 118,498 | 21,340 | ||||||
| Acquisitions | 85 | 0 | 85 | 5 | 89 | 105 | ||||||
| Dispositions | -1,773 | -15 | -1,788 | -985 | -24,293 | -6,822 | ||||||
| Economic Factors | 27 | -13 | 14 | -10 | -2,372 | -391 | ||||||
| Production | -11,562 | -220 | -11,782 | -1,839 | -126,795 | -34,754 | ||||||
| Closing Balance | 153,028 | 2,154 | 155,182 | 38,882 | 2,638,799 |
633,864 |
||||||
|
|
RESERVE LIFE INDEX ("RLI")
ARC's 2P RLI was 15.5 years at year-end 2013 while the proved RLI was 9.1 years based upon the GLJ reserves and ARC's 2014 production guidance mid-point of 112,000 boe per day. The increase in the 2P RLI from 2009 through 2012 was attributed to the successful development of the Montney region and the resultant growth in 2P reserves. Along with the 2P reserves growth, ARC's annual average production increased from 63,538 boe per day in 2009 to 96,087 boe per day in 2013. ARC expects significant year-over-year production growth based on estimated 2014 production of 110,000 to 114,000 boe per day. The decrease in the RLI at year-end 2013 is due to the expected increase in 2014 production, resulting from the development capital spent in 2013 to bring on new production at Parkland, Tower and Sunrise. The following table summarizes ARC's historical RLI.
| Table 4 | |||||||||||||||
| Reserve Life Index | 2013(1) | 2012 | 2011 | 2010 | 2009 | ||||||||||
| Total Proved | 9.1 | 10.5 | 10.7 | 10.4 | 10.3 | ||||||||||
| Proved Plus Probable | 15.5 | 17.5 | 17.0 | 15.1 | 14.4 |
| (1) Based on 2014 production guidance midpoint of 112,000 boe per day. |
NET PRESENT VALUE ("NPV") SUMMARY
ARC's crude oil, natural gas and natural gas liquids reserves were evaluated using GLJ's commodity price forecasts effective January 1, 2014. The NPV is prior to provision for interest, debt service charges and general and administrative expenses. It should not be assumed that the NPV of Cash Flow estimated by GLJ represents the fair market value of the reserves. NPVs on both a before and after tax basis are presented below.
| Table 5 | |||||
| NPV of Cash Flow (1) |
Undiscounted $MM |
Discounted at 5% $MM |
Discounted at 10% $MM |
Discounted at 15% $MM |
Discounted at 20% $MM |
| Before Tax | |||||
| Proved Producing | 6,368 | 4,600 | 3,651 | 3,057 | 2,650 |
| Proved Developed Non-Producing | 249 | 171 | 129 | 103 | 86 |
| Proved Undeveloped | 2,824 | 1,633 | 1,009 | 641 | 407 |
| Total Proved | 9,441 | 6,405 | 4,789 | 3,802 | 3,142 |
| Probable | 7,061 | 3,630 | 2,229 | 1,522 | 1,113 |
| Proved plus Probable | 16,501 | 10,034 | 7,018 | 5,324 | 4,255 |
| After Tax (2)(3) | |||||
| Proved Producing | 5,357 | 3,917 | 3,134 | 2,641 | 2,299 |
| Proved Developed Non-Producing | 186 | 127 | 95 | 75 | 61 |
| Proved Undeveloped | 2,117 | 1,179 | 684 | 392 | 206 |
| Total Proved | 7,660 | 5,223 | 3,913 | 3,107 | 2,566 |
| Probable | 5,294 | 2,691 | 1,624 | 1,087 | 777 |
| Proved plus Probable | 12,954 | 7,913 | 5,538 | 4,194 | 3,343 |
| (1) | Based on NI-51-101 Net Interest reserves and GLJ January 1, 2014 Forecast Prices and Costs. |
| (2) | Based on ARC's estimated tax pools at year-end 2013. |
| (3) | The after-tax net present value of ARC's oil and gas properties here reflects the tax burden on the properties on a stand-alone basis. It does not consider the business-entity-level tax situation, or tax planning. It does not provide an estimate of the value at the level of the business entity, which may be significantly different. ARC's Audited Consolidated Financial Statements and Management's Discussion & Analysis should be consulted for information at the business entity level. |
At a 10 per cent discount factor, and on a before tax basis, proved producing reserves constitute 52 per cent of the 2P estimated value while total proved reserves account for 68 per cent of the 2P estimated value.
FUTURE DEVELOPMENT CAPITAL ("FDC")
NI 51-101 requires that F&D costs be calculated including changes in FDC. Changes in forecast FDC occur annually as a result of development activities, acquisition and disposition activities and capital cost estimates that reflect the independent evaluator's best estimate of what it will cost to bring the proved undeveloped and probable reserves on production. Future development capital declined slightly to $3.3 billion at year-end 2013 relative to $3.4 billion at year end 2012. The increase in FDC from reserve-adding capital in 2013 was offset by lower well costs in certain fields resulting from capital efficiencies gained with the application of multi-well pad development, and a decrease in future drilling locations in certain fields. The decrease in future drilling locations was the result of changes to the development plans for certain fields whereby longer horizontal laterals are planned, resulting in larger reserves per well and requiring fewer wells to access the reserves.
Following is a summary of GLJ estimated FDC required to bring total proved and probable reserves on production.
| Table 6 | ||||||
|
Future Development Capital (1) $ Millions |
Total Proved |
Total Proved + Probable |
||||
| 2014 | 630 | 772 | ||||
| 2015 | 538 | 769 | ||||
| 2016 | 308 | 621 | ||||
| 2017 | 248 | 438 | ||||
| 2018 | 174 | 212 | ||||
| Remainder | 111 | 491 | ||||
| Total FDC undiscounted | 2,009 | 3,303 | ||||
| Total FDC discounted at 10% | 1,645 | 2,588 | ||||
| (1) FDC as per GLJ independent reserve evaluation as of December 31, 2013 and based on GLJ forecast pricing as at January 1, 2014. |
FINDING, DEVELOPMENT AND ACQUISITION COSTS ("FD&A")
ARC's F&D costs were $12.79 per boe and $17.45 per boe for 2P and proved reserves, respectively in 2013, before changes in FDC ($11.47 per boe and $18.11 per boe, respectively, for 2P and proved reserves, including changes in FDC). ARC's three year average F&D costs were $8.24 per boe for 2P reserves and $14.18 per boe for proved reserves, before changes in FDC. The low F&D costs are attributed to the high quality of ARC's property portfolio, excellent results from ARC's development program and strong reserve growth particularly at Sunrise, Septimus, Dawson, Parkland, Tower, Ante Creek, and Pembina.
Including net acquisitions, ARC's 2013 FD&A costs were $13.32 per boe of 2P reserves and $18.31 per boe of proved reserves, before changes in FDC ($12.07 per boe and $19.18 per boe, respectively, for 2P and proved reserves, including changes in FDC). The three year average FD&A costs were $8.39 per boe for 2P reserves and $15.00 per boe for proved reserves, before changes in FDC. ARC's low FD&A costs reflect ARC's focus on high quality assets, cost management and allocation of resources and capital to the highest rate of return projects.
The following table illustrates FD&A costs excluding and including changes in FDC.
| Table 7 | |||||
| Excluding FDC | Including FDC | ||||
|
FD&A costs - Company Gross (1)(2) $ Thousands |
Proved |
Proved + Probable |
Proved |
Proved + Probable |
|
| E&D capital expenditures | 874,190 | 874,190 | 874,190 | 874,190 | |
| E&D capital expenditures - change in FDC | - | - | 33,015 | (90,205) | |
| Total E&D capital expenditures | 874,190 | 874,190 | 907,206 | 783,985 | |
| Net acquisition (disposition) | (53,345) | (53,345) | (53,345) | (53,345) | |
| Net acquisition (disposition) - change in FDC | - | - | 5,885 | 13,535 | |
| Total net acquisition (disposition) | (53,345) | (53,345) | (47,460) | (39,810) | |
|
Total capital including net acquisition (disposition) |
820,846 | 820,846 | 859,746 | 744,175 | |
| E&D reserve additions | 50,107 | 68,353 | 50,107 | 68,353 | |
| Net acquisition (disposition) reserves | (5,281) | (6,717) | (5,281) | (6,717) | |
|
Reserve additions including net dispositions |
44,826 | 61,636 | 44,826 | 61,636 | |
| FD&A costs - $ per boe: | |||||
| F&D Costs - Current Year | 17.45 | 12.79 | 18.11 | 11.47 | |
| F&D Costs - Three Year Average | 14.18 | 8.24 | 17.42 | 12.01 | |
| FD&A Costs - Current Year | 18.31 | 13.32 | 19.18 | 12.07 | |
| FD&A Costs - Three Year Average | 15.00 | 8.39 | 18.57 | 12.47 | |
| (1) | The aggregate of Exploration and Development ("E&D") costs incurred in the most recent financial year and the change during that year in estimated future development costs ("FDC") generally will not reflect total finding and development costs related to reserves additions for that year. |
| (2) | Under NI 51-101, the calculation of F&D costs must incorporate the change in future development capital required to bring the proved undeveloped and probable reserves to production. In all cases, the F&D, or FD&A number is calculated by dividing the identified capital expenditures by the applicable reserves additions both before and after changes in FDC costs. |
| Table 8 | |||||||||||||||
|
Company Gross Historic FD&A Costs ($ per boe) |
2013 | 2012 | 2011 | 2010 | 2009 | ||||||||||
| Proved Reserves: | |||||||||||||||
| Annual FD&A excluding FDC | 18.31 | 16.76 | 11.11 | 13.35 | 10.53 | ||||||||||
| Three year average FD&A excluding FDC | 15.00 | 13.38 | 12.02 | 12.82 | 13.86 | ||||||||||
| Annual FD&A including FDC | 19.18 | 19.96 | 17.13 | 18.21 | 14.36 | ||||||||||
| Three year average FD&A including FDC | 18.57 | 18.25 | 16.95 | 18.04 | 18.41 | ||||||||||
| Proved plus Probable Reserves: | |||||||||||||||
| Annual FD&A excluding FDC | 13.32 | 9.34 | 5.24 | 9.23 | 6.46 | ||||||||||
| Three Year Average FD&A excluding FDC | 8.39 | 7.80 | 7.15 | 8.62 | 9.61 | ||||||||||
| Annual FD&A including FDC | 12.07 | 13.26 | 12.23 | 14.26 | 11.59 | ||||||||||
| Three Year Average FD&A including FDC | 12.47 | 13.30 | 12.90 | 14.08 | 14.81 |
NE B.C. MONTNEY RESOURCES EVALUATION
The following discussion in "NE B.C. Montney Resources Evaluation" is subject to a number of cautionary statements, assumptions and risks as set forth therein. See "Information Regarding Disclosure on Oil and Gas Reserves, Resources and Operational Information" at the end of this release for additional cautionary language, explanations and discussion and "Forward Looking Statements" for a statement of principal assumptions and risks that may apply. See also "Definitions of Oil and Gas Resources and Reserves" in this news release. The discussion includes reference to TPIIP, DPIIP and ECR as per the GLJ Petroleum Consultants Ltd. ("GLJ") Resources Evaluation as at December 31, 2013, prepared in accordance with the Canadian Oil and Gas Evaluation Handbook ("COGE Handbook"). Unless indicated otherwise in this news release, all references to ECR volumes are Best Estimate ECR volumes.
The Montney formation in NE B.C. has been identified as a world class unconventional natural gas resource play with the potential for significant volumes of recoverable resources. The area includes dry gas, liquids-rich gas and crude oil development opportunities. It is one of the largest and lowest cost natural gas resource plays in North America. ARC has a significant presence in the region with a land position of 527 net sections, located primarily in the most prospective areas of the play.
GLJ was commissioned to conduct an Independent Resources Evaluation for ARC's lands in the NE B.C. Montney region including Dawson, Parkland, Tower, Red Creek, Sunrise/Sunset, Attachie, Septimus, Sundown, and Blueberry in northeastern B.C and Pouce Coupe just across the border in Alberta (the "Evaluated Areas"). The Resources Evaluation was effective December 31, 2013 based on GLJ forecast pricing as at January 1, 2014. All references in the following discussion to ECR, TPIIP and DPIIP are in reference to the Evaluated Areas included in the Independent Resources Evaluation. See "Definitions of Oil and Gas Resources and Reserves" in this news release.
The evaluation reaffirmed that the NE B.C. Montney region provides a significant long-term growth opportunity with considerable potential reserves, extending well beyond existing booked reserves and even the current estimates of the Economic Contingent Resource ("ECR"). ARC's NE B.C. Montney assets provide optionality for future growth through commodity price cycles given the diversity of ARC's Montney landholdings with exposure to liquids-rich natural gas, crude oil and dry natural gas. We believe there is considerable upside in our NE B.C. Montney assets given our significant resource base.
ARC's 2013 capital development program was focused on crude oil and liquids rich-gas opportunities throughout ARC's entire asset portfolio while maintaining gas production. In NE B.C., ARC's capital development program consisted of drilling 41 gross operated (40.5 net) wells comprised 13 oil wells at Tower, 15 liquids-rich wells at Parkland and 13 gas wells (nine wells at Dawson, two wells at Sunrise, one well at Attachie and one well at Blueberry).
TPIIP for the gas bearing lands in the evaluated areas increased 10 per cent relative to 2012 to 55.1 Tcf. The 2013 drilling program resulted in a 12 per cent increase of DPIIP for the evaluated areas to 30.4 Tcf. Growth in gas TPIIP and DPIIP is primarily attributed to 2013 land acquisition activity in Attachie, Blueberry and Pouce Coupe.
Natural gas ECR increased to 4.5 Tcf from 4.2 Tcf in the 2012 evaluation and 2P natural gas reserves increased to 2.2 Tcf from 2.1 Tcf. These increases were primarily the result of land acquisitions, drilling activity in 2013 and future drilling activity. The natural gas prospective resources increased slightly from 3.8 Tcf to 3.9 Tcf, primarily due to land acquisitions
NGL 2P reserves associated with the natural gas resource increased 10 per cent from 24.7 mmbbls in the 2012 evaluation to 27.2 mmbbls. NGL's ECR increased five percent from 111.2 mmbbls to 116.5 mmbbls and NGL's prospective resource increased slightly from 113.6 mmbbls to 114.1 mmbbls in 2013, due to increased land holdings.
On the oil bearing lands at Tower, Red Creek and Attachie East, GLJ identified 2,189 mmbbls of TPIIP and 1,714 mmbbls of DPIIP as well as 10.7 mmbbls of ECR and 11.2 mmbbls of 2P reserves. The increase in oil TPIIP and DPIIP is attributed to land acquisition activity at Red Creek. The Tower field is still in the early stages of development and Red Creek is in the exploration stage, therefore additional production data is required to better understand the recoverable potential of these fields. However, with continual advancements in drilling and completion technology, early indications are very favorable for exploitation of this significant oil resource.
The following tables summarize the results of the 2013 and 2012 resources evaluations.
| Table 9a | 2013 | 2012 | ||||
| Natural Gas Resource Categories (1)(2)(3)(4) | Tcf | Tcf | ||||
| Total Petroleum Initially In Place (TPIIP) | 55.1 | 50.1 | ||||
| Discovered Petroleum Initially In Place (DPIIP) | 30.4 | 27.2 | ||||
| Undiscovered Petroleum Initially In Place (UPIIP) | 24.7 | 22.9 |
| (1) | TPIIP, DPIIP and UPIIP have been estimated using a zero percent porosity cut-off which means that all gas bearing rock has been incorporated into the calculations. Using a three per cent porosity cut-off, the 2013 TPIIP, DPIIP and UPIIP estimates would be 42.9 Tcf, 25.2 Tcf, and 17.7 Tcf, respectively. |
| (2) | The Resource Categories in this table do not include the free oil/liquids. |
| (3) | All volumes in table are company gross and raw gas volumes. |
| (4) | TPIIP includes 0.9 Tcf and DPIIP include 0.8 Tcf of solution gas associated with Tower oil and Red Creek oil. |
| Table 9b | 2013 | 2012 | ||||
| Oil Resource Categories (1)(2)(3) | mmbbls | mmbbls | ||||
| Total Petroleum Initially In Place (TPIIP) | 2,189.0 | 1,467.0 | ||||
| Discovered Petroleum Initially In Place (DPIIP) | 1,714.0 | 1,467.0 | ||||
| Undiscovered Petroleum Initially in Place (UPIIP) | 475.0 | - |
| (1) | TPIIP, DPIIP and UPIIP have been estimated using a three percent porosity cut-off for oil due to lower mobility for oil relative to gas. Using a six per cent porosity cut-off, the 2013 TPIIP, DPIIP and UPIIP estimates would be 924 mmbls, 742 mmbbls and 182 mmbbls. |
| (2) | All volumes in table are company gross. |
| (3) | The oil DPIIP is a Stock Tank Barrel ("STB") |
| Table 9c | ||||||
| Reserves and Economic Contingent Resources (1)(2) |
2013 Best Estimate |
2012 Best Estimate |
||||
| Natural Gas (Tcf) | ||||||
| Reserves (3) | 2.2 | 2.1 | ||||
| Economic Contingent Resources | 4.5 | 4.2 | ||||
| Natural Gas Liquids (mmbbls) (4) | ||||||
| Reserves (3) | 27.2 | 24.7 | ||||
| Economic Contingent Resources | 116.5 | 111.2 | ||||
| Oil (mmbbls) | ||||||
| Reserves (3) | 11.2 | 7.6 | ||||
| Economic Contingent Resources | 10.7 | 12.6 |
| (1) | All DPIIP other than cumulative production, reserves, and ECR has been categorized as unrecoverable. Cumulative Raw production to year end 2013 was 0.4 Tcf of gas, 0.5 mmbbls of oil and 4.0 mmbbls of NGLs, which are all immaterial in relation to the Reserves and ECR magnitude. (NGL cumulative production is calculated based on current NGL recoveries). |
| (2) | All volumes in table are company gross and sales volumes. |
| (3) | For reserves, the volume under the heading Best Estimate are 2P reserves. |
| (4) | The liquid yields are based on average yield over the producing life of the property. |
| Table 9d | ||||||
| Prospective Resources (1)(2) |
2013 Best Estimate |
2012 Best Estimate |
||||
| Natural gas (Tcf) | 3.9 | 3.8 | ||||
| Natural gas liquids (mmbbls) | 114.1 | 113.6 |
| (1) | All UPIIP other than Prospective Resources has been categorized as unrecoverable. GLJ estimated DPIIP values using a porosity cut-off of three per cent for natural gas and six per cent for oil. |
| (2) | All volumes in table are company gross and sales volumes. |
Based upon the forgoing analysis and ARC's expertise in the Montney formation in NE B.C., it is expected that significant additional reserves will be developed in the future with continued drilling success on currently undeveloped Montney acreage together with further development, completion refinements and improved economic conditions. Historic drilling success and recoveries on the more fully developed Montney acreage, abundant well log and production test data, and the application of increased drilling densities support ARC's belief that significant additional resources will be recovered. Continuous development through multi-year exploration and development programs and significant levels of future capital expenditures are required in order for additional resources to be recovered in the future. The principal risks that would inhibit the recovery of additional reserves relate to the potential for variations in the quality of the Montney formation where minimal well data currently exists, access to the capital which would be required to develop the resources, low commodity prices that would curtail the economics of development and the future performance of wells, regulatory approvals, access to the required services at the appropriate cost, and the effectiveness of fraccing technology and applications. The primary contingencies that prevent the economic contingent resources from being classified as reserves are the requirement for additional drilling, completion and testing data to confirm commercial production rates for development not immediately offsetting existing production. Confirmation of commercial productivity is generally required before the company can prepare firm development plans and commit required capital for the development of the ECR. Additional contingencies are related to the current lack of infrastructure required to develop the resources in a relatively quick time frame. As continued delineation occurs, some resources currently classified as ECR are expected to be re-classified to Reserves.
DEFINITIONS OF OIL AND GAS RESOURCES AND RESERVES
| Reserves are estimated remaining quantities of oil and natural gas and related substances anticipated to be recoverable from known accumulations, as of a given date, based on the analysis of drilling, geological, geophysical and engineering data; the use of established technology; and specified economic conditions, which are generally accepted as being reasonable. Reserves are classified according to the degree of certainty associated with the estimates as follows: | ||
| Proved Reserves are those reserves that can be estimated with a high degree of certainty to be recoverable. It is likely that the actual remaining quantities recovered will exceed the estimated proved reserves. | ||
| Probable Reserves are those additional reserves that are less certain to be recovered than proved reserves. It is equally likely that the actual remaining quantities recovered will be greater or less than the sum of the estimated proved plus probable reserves. | ||
| Possible Reserves are those additional reserves that are less certain to be recovered than probable reserves. It is unlikely that the actual remaining quantities recovered will exceed the sum of the estimated proved plus probable plus possible reserves. | ||
| Resources encompasses all petroleum quantities that originally existed on or within the earth's crust in naturally occurring accumulations, including Discovered and Undiscovered (recoverable and unrecoverable) plus quantities already produced. "Total resources" is equivalent to "Total Petroleum Initially-In-Place". Resources are classified in the following categories: | ||
| Total Petroleum Initially-In-Place ("TPIIP") is that quantity of petroleum that is estimated to exist originally in naturally occurring accumulations. It includes that quantity of petroleum that is estimated, as of a given date, to be contained in known accumulations, prior to production, plus those estimated quantities in accumulations yet to be discovered. | ||
| Discovered Petroleum Initially-In-Place ("DPIIP") is that quantity of petroleum that is estimated, as of a given date, to be contained in known accumulations prior to production. The recoverable portion of discovered petroleum initially in place includes production, reserves, and contingent resources; the remainder is unrecoverable. | ||
| Contingent Resources are those quantities of petroleum estimated, as of a given date, to be potentially recoverable from known accumulations using established technology or technology under development but which are not currently considered to be commercially recoverable due to one or more contingencies. | ||
| Economic Contingent Resources ("ECR") are those contingent resources which are currently economically recoverable. | ||
| Undiscovered Petroleum Initially-In-Place ("UPIIP") is that quantity of petroleum that is estimated, on a given date, to be contained in accumulations yet to be discovered. The recoverable portion of undiscovered petroleum initially in place is referred to as "prospective resources" and the remainder as "unrecoverable." | ||
| Prospective Resources are those quantities of petroleum estimated, as of a given date, to be potentially recoverable from undiscovered accumulations by application of future development projects. | ||
| Unrecoverable is that portion of DPIIP and UPIIP quantities which is estimated, as of a given date, not to be recoverable by future development projects. A portion of these quantities may become recoverable in the future as commercial circumstances change or technological developments occur; the remaining portion may never be recovered due to the physical/chemical constraints represented by subsurface interaction of fluids and reservoir rocks. | ||
| Uncertainty Ranges are described by the Canadian Oil and Gas Evaluation Handbook as low, best, and high estimates for reserves and resources. The Best Estimate is considered to be the best estimate of the quantity that will actually be recovered. It is equally likely that the actual remaining quantities recovered will be greater or less than the best estimate. If probabilistic methods are used, there should be at least a 50 percent probability (P50) that the quantities actually recovered will equal or exceed the best estimate. | ||
INFORMATION REGARDING DISCLOSURE ON OIL AND GAS RESERVES, RESOURCES AND OPERATIONAL INFORMATION
All amounts in this news release are stated in Canadian dollars unless otherwise specified. Where applicable, natural gas has been converted to barrels of oil equivalent ("BOE") based on 6 Mcf:1 BOE. The BOE rate is based on an energy equivalent conversion method primarily applicable at the burner tip, and given that the value ratio based on the current price of crude oil as compared to natural gas is significantly different than the energy equivalency of the 6:1 conversion ratio, utilizing the 6:1 conversion ratio may be misleading as an indication of value. The BOE rate is based on an energy equivalent conversion method primarily applicable at the burner tip and does not represent a value equivalent at the wellhead. Use of BOE in isolation may be misleading. In accordance with Canadian practice, production volumes and revenues are reported on a company gross basis, before deduction of Crown and other royalties, unless otherwise stated. Unless otherwise specified, all reserves volumes in this news release (and all information derived therefrom) are based on "company gross reserves" using forecast prices and costs. Our oil and gas reserves statement for the year-ended December 31, 2013, which will include complete disclosure of our oil and gas reserves and other oil and gas information in accordance with NI 51-101, will be contained within our Annual Information Form which will be available on our SEDAR profile at www.sedar.com.
This news release contains references to estimates of oil and gas classified as TPIIP, DPIIP, UPIIP and ECR in the Montney region in northeastern British Columbia which are not, and should not be confused with, oil and gas reserves. See "Definitions of Oil and Gas Resources and Reserves".
Projects have not been defined to develop the resources in the Evaluated Areas as at the evaluation date. Such projects, in the case of the Montney resource development, have historically been developed sequentially over a number of drilling seasons and are subject to annual budget constraints, ARC's policy of orderly development on a staged basis, the timing of the growth of third party infrastructure, the short and long-term view of ARC on gas prices, the results of exploration and development activities of ARC and others in the area and possible infrastructure capacity constraints.
ARC's belief that it will establish significant additional reserves over time with conversion of DPIIP into ECR, ECR into 2P reserves and probable reserves into proved reserves is a forward looking statement and is based on certain assumptions and is subject to certain risks, as discussed below under the heading "Forward Looking Information and Statements".
NOTICE TO U.S. READERS
The oil and natural gas reserves contained in this press release have
generally been prepared in accordance with Canadian disclosure
standards, which are not comparable in all respects of United States or
other foreign disclosure standards. For example, the United States
Securities and Exchange Commission (the "SEC") generally permits oil
and gas issuers, in their filings with the SEC, to disclose only proved
reserves (as defined in SEC rules). Canadian securities laws require
oil and gas issuers, in their filings with Canadian securities
regulators, to disclose not only proved reserves (which are defined
differently from the SEC rules) but also probable reserves, each as
defined in NI 51-101. Accordingly, proved reserves disclosed in this
news release may not be comparable to U.S. standards, and in this news
release, ARC has disclosed reserves designated as "probable reserves"
and "proved plus probable reserves". Probable reserves are higher risk
and are generally believed to be less likely to be accurately estimated
or recovered than proved reserves. The SEC's guidelines strictly
prohibit reserves in these categories from being included in filings
with the SEC that are required to be prepared in accordance with U.S.
disclosure requirements. In addition, under Canadian disclosure
requirements and industry practice, reserves and production are
reported using gross volumes, which are volumes prior to deduction of
royalty and similar payments. The practice in the United States is to
report reserves and production using net volumes, after deduction of
applicable royalties and similar payments. Moreover, ARC has determined
and disclosed estimated future net revenue from its reserves using
forecast prices and costs, whereas the SEC generally requires that
prices and costs be held constant at levels in effect at the date of
the reserve report. As a consequence of the foregoing, ARC's reserve
estimates and production volumes in this news release may not be
comparable to those made by companies utilizing United States reporting
and disclosure standards. Additionally, the SEC prohibits disclosure
of oil and gas resources, whereas Canadian issuers may disclose
resource volumes. Resources are different than, and should not be
construed as, reserves. For a description of the definition of, and the
risks and uncertainties surrounding the disclosure of, resources, see
above.
FORWARD-LOOKING INFORMATION AND STATEMENTS
This news release contains certain forward-looking information and
statements within the meaning of applicable securities laws. The use of
any of the words "expect", "anticipate", "continue", "estimate",
"objective", "ongoing", "may", "will", "project", "should", "believe",
"plans", "intends", "strategy" and similar expressions are intended to
identify forward-looking information or statements. In particular, but
without limiting the foregoing, this news release contains
forward-looking information and statements pertaining to the following:
the recognition of significant additional reserves under the heading
"2013 Independent Reserve Evaluation" and the recognition of
significant resources under the heading "NE B.C. Montney Resources
Evaluation", the volumes and estimated value of ARC's oil and gas
reserves; the life of ARC's reserves; the volume and product mix of
ARC's oil and gas production; future oil and natural gas prices; future
results from operations and operating metrics; and future development,
exploration, acquisition and development activities (including drilling
plans) and related production expectations.
The forward-looking information and statements contained in this news release reflect several material factors and expectations and assumptions of ARC including, without limitation: that ARC will continue to conduct its operations in a manner consistent with past operations; results from drilling and development activities consistent with past results; the continued and timely development of infrastructure in areas of new production; the general continuance of current industry conditions; the continuance of existing (and in certain circumstances, the implementation of proposed) tax, royalty and regulatory regimes; the accuracy of the estimates of ARC's reserve and resource volumes; certain commodity price and other cost assumptions; and the continued availability of adequate debt and equity financing and cash flow to fund its plans expenditures. There are a number of assumptions associated with the development of the Evaluated Areas, including the quality of the Montney reservoir, continued performance from existing wells, future drilling programs and performance from new wells, the growth of infrastructure, well density per section, and recovery factors and development necessarily involves known and unknown risks and uncertainties, including those risks identified in this press release. ARC believes the material factors, expectations and assumptions reflected in the forward-looking information and statements are reasonable but no assurance can be given that these factors, expectations and assumptions will prove to be correct.
The forward-looking information and statements included in this news release are not guarantees of future performance and should not be unduly relied upon. Such information and statements involve known and unknown risks, uncertainties and other factors that may cause actual results or events to differ materially from those anticipated in such forward-looking information or statements including, without limitation: changes in commodity prices; the early stage of development of some areas in the Evaluated Areas; the potential for variation in the quality of the Montney formation, changes in the demand for or supply of ARC's products; unanticipated operating results or production declines; unanticipated results from ARC's exploration and development activities; changes in tax or environmental laws, royalty rates or other regulatory matters; changes in development plans of ARC or by third party operators of ARC's properties, increased debt levels or debt service requirements; inaccurate estimation of ARC's oil and gas reserve and resource volumes; limited, unfavorable or a lack of access to capital markets; increased costs; a lack of adequate insurance coverage; the impact of competitors; and certain other risks detailed from time to time in ARC's public disclosure documents (including, without limitation, those risks identified in this news release and in ARC's Annual Information Form).
The forward-looking information and statements contained in this news release speak only as of the date of this news release, and none of ARC or its subsidiaries assumes any obligation to publicly update or revise them to reflect new events or circumstances, except as may be required pursuant to applicable laws.
ARC Resources Ltd. ("ARC") is one of Canada's largest conventional oil and gas companies with an enterprise value of approximately $10 billion. ARC expects 2014 oil and gas production to average 110,000 to 114,000 barrels of oil equivalent per day from its properties in western Canada. ARC's Common Shares trade on the TSX under the symbol ARX.
ARC RESOURCES LTD.
Myron M. Stadnyk
President and Chief Executive Officer
SOURCE ARC Resources Ltd.
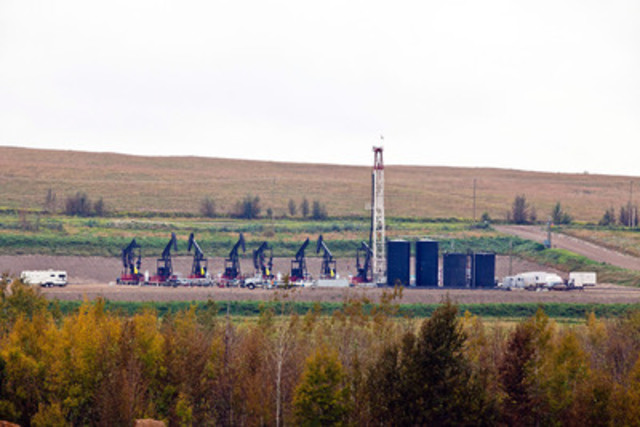
Image with caption: "ARC Resources' Tower Well Pad in northeast British Columbia. (CNW Group/ARC Resources Ltd.)". Image available at: http://photos.newswire.ca/images/download/20140205_C7666_PHOTO_EN_36327.jpg

For further information:
For further information about ARC Resources Ltd., please visit our website www.arcresources.com or contact:
Investor Relations, E-mail: ir@arcresources.com
Telephone: (403) 503-8600 Fax: (403) 509-6427
Toll Free 1-888-272-4900
ARC Resources Ltd.
Suite 1200, 308 - 4th Avenue S.W.
Calgary, AB T2P 0H7